

Review Article
Volume-1 Issue-1, 2021
Chemometric Modeling and in silico Design of Tumor-Associated Carbonic Anhydrases IX Sulfocoumarins Inhibitors
Received Date: December 18, 2021
Accepted Date: January 17, 2022
Published Date: January 19, 2022
Journal Information
Abstract
We have attempted to build QSAR models on TumorAssociated Carbonic Anhydrase, hCA IX inhibitory activity. The quality of prediction is high enough (Se =0.2306, r2 =0.9027, F =40.1919, r2cv =0.7716). The virtual molecular fragment that leads to a significant increase in the inhibitory activity of hCA IX is C2HN3. The virtual fragments, Br atom and NO2 lead to a significant decrease of the inhibitory activity value. The innovation of this work consists in not only exploring the structural attributes of bioactive molecules but also in its ability to predict in silico the structures of twenty eight new (not yet synthesized) compounds which may show Tumor-Associated Carbonic Anhydrase IX (hCAIX) inhibitory activity. This apart, search for more suitable compounds was made based on their pharmacokinetic behaviour and ease of synthesis. The molecules of the prediction set include many molecules having high computed activity.
Key words
CAIX inhibitor; Sulfocoumarins (1,2-benzoxathiine-2,2-dioxides) QSAR; Preclav; Brood; Dragon
Comp. No. |
R |
Obs. Ka (µM) |
A |
A |
Residu al |
R |
hat Diagonal |
Comp. No. |
A |
hat Diagona l |
Comp. No. |
A |
hat Diagonal |
1. |
6-0H |
0.3 |
3.7782 |
3.776 |
0.002 |
0.01 |
0.2455 |
1 |
4.946 |
0.1904 |
17. |
4.401 |
0.0711 |
2. |
6-MeSO3 |
0.324 |
3.7447 |
3.594 |
0.151 |
0.6152 |
0.1431 |
2 |
5.108 |
0.2964 |
18. |
4.953 |
0.2941 |
3.* |
5,6-benzo |
0.375 |
3.6812 |
3.438 |
0.243 |
1.046 |
0.1789 |
3 |
4.664 |
0.1036 |
19. |
4.969 |
0.6389 |
4. |
6-Br |
6.88 |
2.4177 |
3.001 |
-0.583 |
-6.3761 |
0.4575 |
4 |
5.484 |
0.628 |
20. |
5.201 |
0.7325 |
5.* |
6-O2N |
3.77 |
2.6789 |
2.627 |
0.051 |
0.5107 |
0.8565 |
5 |
5.392 |
0.5005 |
21. |
4.265 |
0.1043 |
6. |
6-H2N |
0.046 |
4.5925 |
4.356 |
0.237 |
1.3523 |
0.507 |
6. |
5.215 |
0.4857 |
22. |
4.194 |
0.2203 |
7. |
Ph |
0.029 |
4.7929 |
4.551 |
0.242 |
0.9973 |
0.1174 |
7. |
5.297 |
0.7077 |
23. |
4.679 |
0.127 |
8. |
COOMe |
0.095 |
4.2775 |
4.17 |
0.108 |
0.4487 |
0.1922 |
8. |
5.087 |
0.2937 |
24. |
3.919 |
0.5149 |
9. |
COOEt |
0.086 |
4.3208 |
4.22 |
0.101 |
0.3953 |
0.0814 |
9. |
4.664 |
0.1592 |
25. |
3.931 |
0.2734 |
10.* |
Me3Si |
0.06 |
4.4771 |
4.763 |
-0.286 |
-1.2818 |
0.209 |
10. |
4.831 |
0.1568 |
26. |
3.373 |
0.6055 |
11. |
HOCH3 |
0.058 |
4.4918 |
4.471 |
0.021 |
0.0823 |
0.1438 |
11. |
4.377 |
0.1426 |
27. |
3.82 |
0.182 |
12. |
Et2NCH2 |
0.025 |
4.8573 |
5.096 |
-0.239 |
-1.0445 |
0.2078 |
12. |
4.737 |
0.221 |
28. |
4.263 |
0.1834 |
13. |
4F3COC |
0.074 |
4.386 |
4.381 |
0.005 |
0.0214 |
0.1415 |
13. |
4.731 |
0.2324 |
|
|
|
14. |
4-MeO- |
0.018 |
5 |
4.95 |
0.05 |
0.2092 |
0.2027 |
14. |
4.726 |
0.2574 |
|
|
|
15. |
3-F3C- |
0.048 |
4.574 |
4.415 |
0.159 |
0.6575 |
0.1568 |
15. |
5.366 |
1.3282 |
|
|
|
16.* |
3-MeO- |
0.049 |
4.5651 |
4.827 |
-0.262 |
-1.1203 |
0.159 |
16. |
4.518 |
0.3048 |
|
|
|
Comp. |
Log p |
TPSA |
lip |
lipsn |
RBN |
MW |
cRo5 |
DLS |
DLS_ |
DLS_ |
nH |
nH Acc |
MLOGP |
1 |
2.98 |
91.69 |
7 |
0 |
3 |
403.87 |
1 |
1 |
1 |
1 |
0 |
6 |
2.912 |
2 |
3.01 |
91.69 |
7 |
0 |
3 |
417.9 |
1 |
1 |
1 |
1 |
0 |
6 |
3.14 |
3 |
2.7 |
91.69 |
7 |
0 |
3 |
405.41 |
1 |
1 |
1 |
1 |
0 |
8 |
2.912 |
4 |
2.79 |
91.69 |
7 |
0 |
4 |
397.49 |
1 |
1 |
1 |
1 |
0 |
6 |
3.14 |
5 |
1.92 |
94.93 |
8 |
0 |
4 |
398.48 |
1 |
1 |
1 |
1 |
0 |
7 |
2.164 |
6 |
2.41 |
102.69 |
7 |
1 |
2 |
438.31 |
1 |
1 |
1 |
1 |
1 |
6 |
3.14 |
7. |
1.36 |
102.69 |
7 |
1 |
2 |
355.4 |
1 |
1 |
1 |
1 |
1 |
6 |
2.443 |
8 |
1.68 |
102.69 |
7 |
1 |
2 |
375.81 |
1 |
1 |
1 |
1 |
1 |
6 |
2.443 |
9. |
2.62 |
82.46 |
6 |
0 |
2 |
373.84 |
1 |
1 |
1 |
1 |
0 |
5 |
3.171 |
10. |
2.25 |
82.46 |
6 |
0 |
2 |
339.4 |
1 |
1 |
1 |
1 |
0 |
5 |
2.934 |
11. |
2.56 |
82.46 |
6 |
0 |
2 |
359.81 |
1 |
1 |
1 |
1 |
0 |
5 |
3.202 |
12. |
-0.39 |
98.67 |
7 |
1 |
4 |
319.37 |
1 |
1 |
1 |
1 |
1 |
6 |
0.898 |
13. |
-0.69 |
102.69 |
7 |
1 |
3 |
293.33 |
1 |
1 |
1 |
1 |
1 |
6 |
0.844 |
14. |
0.83 |
100.66 |
6 |
2 |
2 |
312.75 |
1 |
1 |
1 |
1 |
2 |
5 |
1.331 |
15. |
-0.56 |
128.71 |
8 |
2 |
2 |
294.32 |
1 |
1 |
1 |
1 |
3 |
7 |
1.439 |
16. |
1.14 |
89.8 |
6 |
1 |
2 |
326.78 |
1 |
1 |
1 |
1 |
1 |
5 |
1.595 |
17. |
0.71 |
91.69 |
7 |
0 |
3 |
307.36 |
1 |
1 |
1 |
1 |
0 |
6 |
1.928 |
18. |
-1.16 |
125.55 |
8 |
1 |
2 |
292.3 |
1 |
1 |
1 |
1 |
2 |
7 |
0.413 |
19. |
0.2 |
89.8 |
6 |
1 |
3 |
306.37 |
1 |
1 |
1 |
1 |
1 |
5 |
1.059 |
20. |
-0.07 |
120.12 |
7 |
2 |
2 |
279.33 |
1 |
1 |
1 |
1 |
4 |
5 |
-2.309 |
21. |
0.92 |
86.64 |
6 |
0 |
1 |
290.32 |
1 |
1 |
1 |
1 |
0 |
5 |
1.126 |
22. |
1.95 |
80.43 |
5 |
1 |
1 |
296.75 |
1 |
1 |
1 |
1 |
1 |
4 |
2.103 |
23 |
1.72 |
93.32 |
6 |
1 |
2 |
291.36 |
1 |
1 |
1 |
1 |
1 |
5 |
2.687 |
24. |
1.51 |
82.46 |
6 |
0 |
1 |
313.31 |
1 |
1 |
1 |
1 |
0 |
7 |
2.955 |
25. |
1.55 |
82.46 |
6 |
0 |
2 |
313.31 |
1 |
1 |
1 |
1 |
0 |
7 |
2.955 |
26. |
1.22 |
82.46 |
6 |
0 |
1 |
317.27 |
1 |
1 |
1 |
1 |
0 |
8 |
2.821 |
27. |
0.46 |
104.22 |
6 |
1 |
1 |
273.29 |
1 |
1 |
1 |
1 |
1 |
5 |
0.984 |
28. |
1.46 |
82.46 |
6 |
0 |
3 |
291.36 |
1 |
1 |
1 |
1 |
0 |
5 |
2.687 |
 |
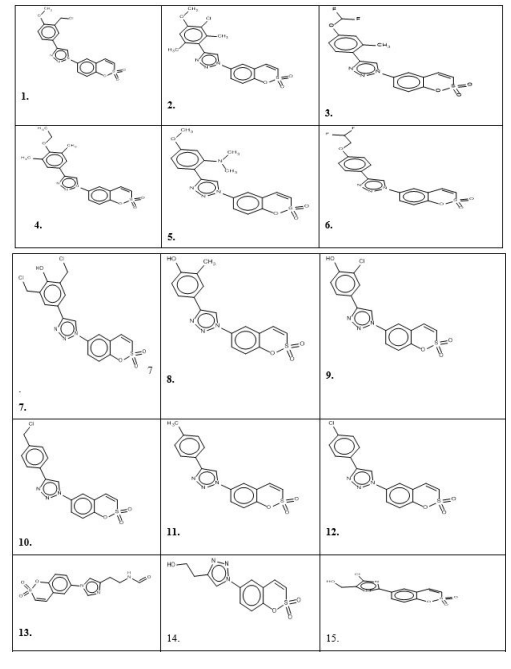  |
| Figure 2:Predicted compound |
 |
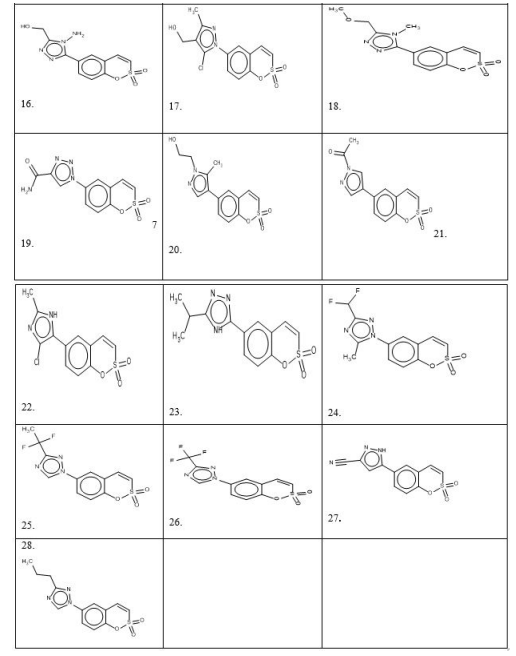
| Figure 3:Graphs of observed vs. estimated activity in the calibration set and validation set |
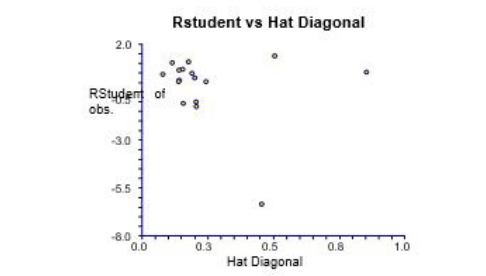 |
| Figure 4: |RStudent| of observed vs. Hat Diagonal |
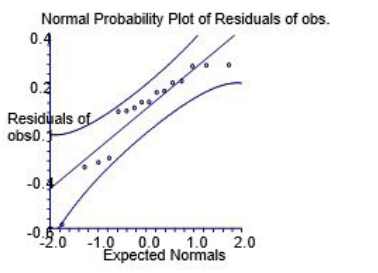 |
| Figure 5: Normal Probability Plot of Residuals of obs |
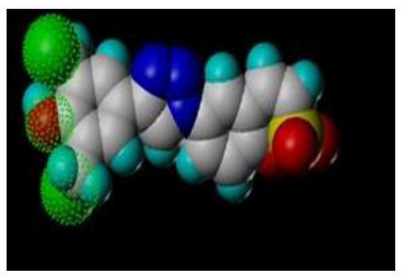 |
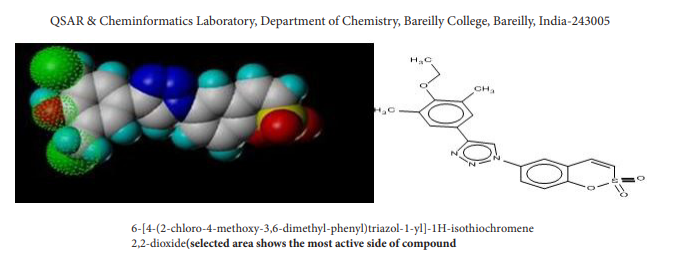
| Figure 6: Selected area shows the most active side of compound |
 |
Introduction
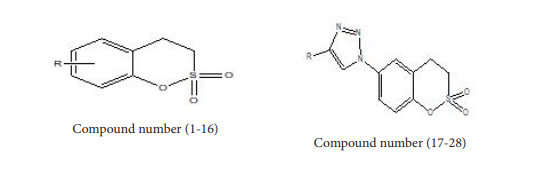
Coumarins are structurally related to lactones and can be prepared from ortho-hydroxy aldehydes using Perkin reaction. Alternatively, these can be synthesized from resorcinol and ethyl acetoacetate in presence polyphosphoric acid applying Pechmann condensation. Natural sources of coumarins are many and varied. These are found in higher plants and rich sources are the Rutaceae family and Umbelliferone. Effective inhibitors of the metalloenzyme human carbonic anhydrase (CA, EC 4.2.1.1) [1- 3] were found in the natural product secluded from the Australian plant Leionema ellipticum, (Rutaceae) or the simple unsubstituted coumarin. Substituted coumarin such as sulfocoumarins (1,2-benzoxathiine- 2,2-dioxides) is the most important [4] class of potent and isoform-selective Inhibitor of Tumor-Associated Carbonic Anhydrase hCA IX [4]. Our aim was to the give best QSAR model and design compounds which have higher activity and good pharmacokinetic properties.
Materials and Methods
We have obtained from literature, the inhibitory activity of 16- Sulfocoumarin against hCA IX [4]. The QSAR model was developed by taking in a known structure and a known value of the inhibitory activity and their structures are shown in Table 1; By the equation, A = log(c/KI) where c was taken as 700 in order to obtain large values of ‘A’, KI activity originally determined in nanomolar values was converted to ‘A’. The inhibitory activity value ‘A’ of the molecules under the study spanning a range from 3 to 5 is more suggestive (Figure 1).
The main aim of computational drug discovery is to find a novel bioactive molecule. Compounds 15, 13, and 16 of calibration set displayed better potency towards hCA IX inhibition, as shown by their low micromolar or submicromolar affinities towards the enzyme, as evidenced by KIs values (Table 1).
The prediction set contains 28 prospective novel Coumarin sulfonamide derivatives generated by BROOD5 software, of which molecules 15, 13 and 17 are more active than others, as shown in Figure 2, having unknown observed values of activity presented in Table 1 [1-28].
Dummy variables are represented by drug-like indices taking value equal to one when all the criteria of the consensus definition of a drug-like molecule are satisfied, or 0 otherwise. A drug-like score is a real value ranging from 0 to 1, calculated as the fraction of criteria satisfied: a score of 1 indicates that a compound is a good candidate to be a drug, whereas a score of 0 indicates that a compound will likely not be a drug [6].
Based on their profiles and physical properties which explain the ‘drug-likeness’ and bioavailability, the structures of the proposed molecules were selected. It is imperative that the investigated molecules should not be more than 5 hydrogen bond donors, 10 hydrogen bond acceptors and the molecular weight should not be more than 500. Their partition coefficient (XLogP) in water/ octanol system should also be less than 5. Several pharmacokinetic properties- Lipinski violations [7], flexibility as well as several common measures of bioavailability for each potential analog were calculated by Dragon. The transport properties of molecules which are also related to drug bioavailability are predicted by Topological Polar Surface Area (TPSA). Oral bioavailability is inversely proportional to TPSA or passively absorbed molecules with a TPSA lower than 140 Å are considered to have low oral bioavailability. It is imperative that the TPSA value should not be more than 140 and rotatable bonds should be within 20. The pharmacopeia which is a measure of bioavailability (XLogP < 5.88 and TPSA < 131.6) was also carried out on prediction set molecules.
The index DLS_01 is a drug-like score based on the Lipinski’s rules [7].
There are more than 5 H-bond donors (nHDon)
There are more than 10 H-bond acceptors (N + O)
Molecular weight (MW) is over 500
Moriguchi's logP (MLogP) is over 4.15
The index DLS_06 is a drug-like score based on rules derived by the filter proposed in [8]
H-bond donors (nHDon) ≤ 5
H-bond acceptors (N + O) in ≤ 10;
molecular weight (MW) ≤ 500
Moriguchi's logP (MLogP) ≤ 5
rotatable bond number (RBN) ≤ 10
polar surface area (TPSA(tot)) ≤ 140
Lipnski Alert index
Compounds with low probability of useful oral activity because of poor absorption are identified by Lipinski Alert Index (LAI) [6-9]. With the aim of obtaining a drug-like index, Dragon also provides the complementary Lipinski Alert Index (cRo5), which is calculated as 1 minus LAI.
The Lipinski Alert Index, also known as 'the rule of 5', in the discovery setting, predicts that poor absorption or permeation is more likely when:
there are more than 5 H-bond donors (nHDon)
there are more than 10 H-bond acceptors (N + O)
molecular weight (MW) is over 500
Moriguchi's logP (MLogP) is over 4.15
The index DLS_07 is a drug-like score based on the two rules of the filter proposed in
a) number of rotatable bonds (RBN) ≤ 10, and
b) polar surface area (TPSA(tot)) ≤ 140 Å [2] or the sum of
H-bond acceptors and H-bond donors ≤ 12.
For each compound, the minimum energy geometry is performed by the conformational search capability of the Omega v.2.4 [12,13] program. In order to avoid any influences on conformational model generation by presenting 3D seed structures, isomeric SMILES notation was used as program input. In combination with variants of the Merck molecular force field 94, Omega employs a rule-based algorithm [12,13]. The 94s variant of the MMMF_NoEstat (Merck Molecular force field) was used as force field [12-14]. It includes all MMFF terms except coulomb interactions. Obtained through molecular mechanics calculations, the conformations of minimum energy were further minimized by quantum chemical calculations. In order to optimize the geometry more thoroughly, the semi empirical PM6 method [15] included in the MOPAC 2009 software [16].
In order to compute special molecular properties, as well as physicochemical, electronic, constitutional, virtual fragmentation descriptors and whole molecule quantum chemical (global) descriptors, the energy minimized structure is used. For each molecule MOPAC [12-16] and PRECLAV [17] programs are calculated over many descriptors. Different descriptors that are investigative of molecular structure and are used as independent variable are the parameters involved in the computation.
Recognition of the “significant” descriptors uses definite criterion [18]. The “significant” descriptors are those which are satisfactorily correlated with the dependent property. The variables having high enough diversity of values are measured important only if their quality q is high enough.
q > 1 (1)
Where , q = (1 - min r2) · / (1 – r2) (2)
(here, min r2 = 0.01) and r2 is the square of the Pearson linear correlation between the values of the analyzed descriptor and the values of the dependent property.
The experimental information related to biological activity the QSAR model built by dependent variables. For obtaining the parameters and for the statistical analysis as reported earlier [19- 28], the PRECLAV algorthim [17,18] was used.
PRECLAV computes thousands of QSAR equations i.e. multilinear formula, using only the significant descriptors [17,18].
The program combines successively sets with 2, 3, …, k significant descriptors (1 < k < 11).
rij2< N-1/2 (3)
Where: rij2 = square of Pearson linear correlation between the values of two descriptors present in the Same set and N = number of molecules in the calibration set (here N = 16). Multilinear QSAR equation of type (3) is calculated by using each set of descriptors,
A=C0+∑Ck•Dk (4)
Where: A = a dependent property (here the inhibitory activity defined above)
C0 = intercept (free term)
Ck = coefficients to the descriptors (weighting factors)
Dk = significant descriptors
k = number of descriptors in the set
This is an important observation. The errors related to regression coefficients are not computed by The PRECLAV program.
By the specified method [15], the relative Utility (U) of a certain descriptor was computed. In estimating the activity the descriptors having a high value [0-1000] are highly useful because of their good correlation with activity. In this way, significant information about the variation of activity in different molecules is provided by each useful descriptor.
The ‘quality’ of each QSPR is computed by the usual statistical formulae. Actually, these formulae are a measure of agreement of observed/computed values of activity: standard error of estimation Se, Pearson square correlation r2, Fisher function F and cross-validated Pearson square correlation r2CV.The concordance between the calculated/observed values has been calculated using the quality function Q [18] which possesses values in the interval {-1, 1}.
Q=r2•(N–k)/N (5)
Where r2 = Pearson square linear correlation between computed/ observed values, N = number of molecules in the calibration set (here N=16). The quality Q of the equations increases by increasing the number of descriptors k. It reaches a maximum, and then decreases. For predictions and descriptors present in the equation are known as ‘predictors’, the equation with the highest Q was used. The best method to evaluate quality of regression model is Leave one out (LOO) cross validation. In this method, a biological activity value is divided into subsets (number of subsets = number of data points) of equal size. Homogeneity of calibration set from the point of view of predictors' set is calculated by the cross-validated function r2CV is a measure of. We can say from the point of view of structure property relationships. The rank correlation Kendall is also used to validate the model.
Tarko L. reported that [29,30] PRECLAV divides the analyzed molecules into virtual fragments using an algorithm. PRECLAV recognized virtual fragments do not always [15] coincide with the classical functional groups. The inhibitory activity of the molecule is predominantly affected by the presence or absence of significant fragments in the molecule predominantly affects.
The similarity of chemical nature between calibration set and prediction set [31] influence the predictive power of a model on the new data set. In order to screen new compounds if their domain of application is defined [32,33], a QSAR model can be used.In the OECD guidelines for QSAR model validation [34,35] also emphasize the need to typify the model applicability domain. QSAR model should only be used for making predictions of compounds that fall within the particular domain and may be considered reliable. One simple approach to define-the applicability of the domain is the extent of extrapolation [36,38]. This is based on the calculation of the hat diagonal (leverage) hi for each chemical, where the QSAR model is used to predict its activity [39].
hi=¼xiT(XTX )-1 xi (6)
Where; xi = the descriptor-row vector of the query molecule and X = k x n matrix containing the k descriptor values for each one of the n training molecules.
A hat diagonal (leverage) value >3(k + 1) ⁄ n (leverage warning limit is considered large. Outliers are observations that are poorly fit by the regression model. Unless a proper reason for their removal is present, Outlying compounds should not be removed. Comparisons observed between residuals are difficult because the variance among them is not constant. To standardize the residuals [40,41] by dividing them by their standard deviations is one of the solution. This provides a set of residuals with constant variance. |RStudent| (cross-validated Leave one out standardized residuals) [40] is a standardized residual that has the impact of a single observation removed from the mean square error. A molecule is defined as an outlier in which |RStudent| > 2 [40]. To visualize the applicability of domain of a developed QSAR model, William plot was used. In the William plot, |RStudent| versus leverage values (hi) are plotted. This plot could be used for a direct and simple graphical finding of both the response outliers and structurally important compounds in a model.
Results and Discussion
Using the specific formulae and procedures of the PRECLAV program algorithm, the statistical computations were conducted. Using only the “significant” descriptors, PRECLAV computed ten thousand QSPR type (3) multilinear equations. The quality of the obtained equations can be reflected by the value of the Q function and also by the values of some usual statistical functions. During the PRECLAV MLR analysis, it was observed that the equation with the highest value of the Q function is a 3-parametric model and also that this model holds the highest predictive power, which is as follows:
Dependent property: hCA IX inhibitory activity, Molecule number in calibration set: 16
Number of “significant” descriptors in the presence of prediction set = 242
A =2.0212+ 0.1232 (D1) +0.6374 (D2) -0.4514 (D3)
Whereas the quality of correlation is described by the statistical indices:
Se =0 .2306, r2 =0.9027, F =40.1919, r2cv =0.7716 K =0 .7833
Se = standard error of values, r2=Pearson square correlation, F =Fisher function, r2cv= Pearson cross-validated square correlation (Leave one out method), K = Kendall rank correlation,
D1=RDF010s (U=805); D2=RMS (U=1000); D3= nsn (U= 220)
D1 = RDF010s; Radial Distribution Function - 010 / weighted by
I-state RDF descriptors Weighted by I-state(U=805)
D2 = pon RMS of distances to geometric center (H and halogen
atoms) (U=1000)
D3 = nsn Minimum net charge of N atoms(u=220)
The positive correlation of the D1 predictor shows that the increase of the value of this descriptor increases the activity, the high value of this predictor is compound no.12 and 14: these are most active compounds. This predictor has higher usability descriptor (U=1000). The positive correlation of D2 predictors (U=805) shows that an increase in the value of this descriptor increases the activity. Compounds 10, 11, 12 and 14 have a high value of this predictor; nsn is a very low value of the utility so this is not influential descriptor.
The molecules in the analyzed database include 20 molecular fragments.There are 3 significant molecular fragments. In the presence of the chemical and statistical outliers, the most significant molecular fragments by correlation of the 'mass percents' and 'Property values are
Fragment atoms Specimen Correlation C2HN3 comp. 8. to 16out 0.7205 Br atom comp.4.out -0.6304 NO2 comp.5.out - 0.5361
Here, it can be seen that the low activity found in observed values is in data set, comp.4 and comp. 5. Drug like descriptor, Logp, TPSA, Lipinsky A, Lipinsky D, RBN, MW, cRo5, DLS_1,DLS_06,DLS_07, nHDonor, n acceptor M log p are all within the range and show excellent result.
In this work, the molecules with rank 3,5,10 and 16 for QSAR study constituted the validation set and the remaining molecules formed the reduced calibration set. All the features and spanned the activity range of the entire dataset were captured by the validation set of 04 molecules (22% of the database). It can be assumed that the reduced calibration set obtained in this method is a representative sample for the calibration set. The reduced calibration set was formed by the remaining 12 molecules. In the presence of a validation set, the most important tool is the correlation between the estimated and experimental values of QSAR equation for the molecules in the validation set. In the presence of the validation set, we obtained the three parametric models for the reduced calibration set (for 12 molecules) with the predictors used in the above QSAR study and these results were obtained:
QSAR #2 r2 =0.90942; F=26.77215;Se= 0.2464; r2pred =0.84128
Hence, it can be inferred that the estimated values for the molecules in the validation set are close to the experimental ones and we have put the molecules in a series alike, in the order of the actual CAIX inhibition activity value. This was confirmed by graph (Figure 2) between observed and estimated values of the calibration set and the validation set. The predictive r2 (r2 pred > 0.5) parameter indicates significant ability of the developed model to predict the CAIX inhibition activity (log inhibition constant) of new compounds.
|RStudent| of observed inhibitory activity and Hat diagonal (leverage) are used to assign applicability of domain (AD). Table 1 shows the values for leverage calculated for both calibration set and prediction set compounds. The applicability of domain for the developed model of calibration set is shown by the William plot (Figure 3). The Influential compounds are the points with leverage value higher than the warning limit. Therefore no outlier present in calibration set except comp. no. 5 but as the R Student is within limit, we have not considered it as an outlier.
It is shown in the William Plot that all molecules in calibration set lie in the application domain of the developed model. The predicted compound shows that diagonal is within the limit (0.75) except the compound 15 but this compound shows not only good predicted activity but also excellent pharmacokinetic values. Because of this, we have considered it.
In case the residuals are normally distributed, the data points of the normal probability plot will fall along a straight line through the origin with a slope of 1.0 [40]. Deviations, if any, from this point reflect departure from normal position. Stragglers at either end of the normal probability plot indicate outliers; curvature at both ends of the plot indicates long or short distributional tails, convex or concave curvature indicates a lack of symmetry, and gaps or plateaus or segmentation in the normal probability plot may require a closer examination of the data or model [40]. Figure 3 shows the graph in corroboration of what we have mentioned above. In figure 5, selected area of the compound 4 has been shown, which depicts the active side of compound.
Conclusion
Statistically, significant linear QSAR models imply the proposal of CA IX activity for data representation, data modeling and data prediction. The predicted compounds show excellent drug like properties, as indicated by high values of different parameters applied. In a way, the result of the study has offered a range of compounds ready to be synthesized for inhibition of the insidious, tumour- related hCAIX.
Polarity plays dominant role for the activity and C2HN3 fragment is favorable for the CA IX activity whereas Br atom and NO2 group are not favorable to activity.
Thus, an attempt has been made to design and develop novel drugs against CA IX activity on a rational basis so as to mitigate the test and fault issue and predict the biological activity before synthesis.
Conflict of the Interest
The author declares that there is no conflict of interest.
Acknowledgments
This article is dedicated to the memory of the late Prof. Padmakar V. Khadikar (1936–2012). We express our thanks to the Open eye software.
Chemometric modeling and in silico design of Tum Associated Carbonic Anhydrases IX Sulfocoumari inhibitors
References
- Vu H, Quinn RJ (2008) Direct screening of natural product extracts using mass spectrometry. J Biomol Screening 13: 265-75.
- Maresca A, Temperini C, Pochet L, Masereel B, Scozzafava A, et al. (2010) Deciphering the mechanism of carbonic anhydrase inhibition with coumarins and thiocoumarins. J Med Chem 53: 335-44.
- Maresca A, Supuran CT (2010) Coumarins incorporating hydroxy- and chloro- moieties selectively inhibit the transmembrane, tumor-associated carbonic anhydrase isoforms IX and XII over the cytosolic ones I and II. Bioorg Med Chem Lett 20: 4511-4.
- Kaspars T, Vullo D, Kazaks A, Leitans J, Lends A, et al. (2013) Sulfocoumarins (1,2-Benzoxathiine-2,2-dioxides): A Class of Potent and Isoform Selective Inhibitors of Tumor-Associated Carbonic Anhydrases. J Med Chem 56: 293-300.
- BROOD (2010) Open Eye Science Software, 3600 Cerrillos Road, Suite 1107, Santa Fe, USA.
- Talete SRL (2007) DRAGON Plus for windos software for molecular descriptor calculations version 5.5, Milano, Italy.
- Lipinski CA, Lombardo F, Dominy BW, Feeney PJ (1997) Experimental and computational approaches to estimate solubility and permeability in drug discovery and development settings. Adv Drug Deliv Rev 23: 3-25.
- Rishton GM (2003) Nonleadlikeness and leadlikeness in biochemical screening. Drug Discov Today 8: 86-96.
- Lipinski CA, Lombardo L, Dominy BW, Feeney PJ (2001) Experimental and computational approaches to estimate solubility and permeability in drug discovery and development. Advanced Drug Delivery Reviews 46: 3-26.
- Veber DF (2002) Molecular properties that influence the oral bioavailability of drug candidates. J Med Chem 45: 2615-23.
- Ertl P, Rohde B, Selzer P (2000) Fast calculation of molecular polar surface area as a sum of fragment-based contributions and its application to the prediction of drug transport properties. J Med Chem 43: 3714.
- OMEGA (version 2.4.3) (2010) OpenEye Science Software, 3600 Cerrillos Road, Suite 1107, Santa Fe, USA.
- Tresadern G, Bemporad DT, Howe A (2009) comparison of ligand based virtual screening methods and application to corticotropin releasing factor 1 receptor. Mol Graph Model 27: 860- 70.
- Halgr TA (1999) MMFF VI. MMFF94s option for energy minimization studies. J Comput Chem 20: 720-9.
- Stewart JJP (2007) Optimization of parameters for semiempirical methods V: modification of NDDO approximations and application to 70 elements. J Mol Model 13: 1173-213.
- Stewart JJP, MOPAC (2012) Stewart Computational Chemistry, Colorado Springs, CO, USA.
- PRECLAV v. 1011 (2010) (documentation included) is available from Center of Organic Chemistry – Bucharest, Romania.
- Tarko L (2005) QSAR studies related to toxicity of aromatic compounds on Tetrahymena pyriformis. Rev Chim 56: 639-48.
- Tarko L, Stecoza CE, Ilie C, Chifiriuc MC (2009) QSAR Studies on antibacterial activity of some substituted dihydrodibenzothiepins, Rev Chim 60: 476-9.
- Singh S, Supuran CT (2014) Chemometric modeling of breast cancer associated carbonic anhydrase IX inhibitors belonging to the ureido-substituted benzene sulfonamide class. J Enzyme Inhib MedChem 29: 877-83.
- Singh S, Supuran CT (2013) Chemometric QSAR Modeling and In Silico Design of Carbonic Anhydrase Inhibition of a Coral Secretory Isoform by sulphonamide. Bioorg & Med Chem 21: 1495-502.
- Singh S (2015) In silico molecular modeling of carbonic anhydrase inhibitors: Inhibition of Plasmodium falciparum carbonic anhydrase with aromatic/heterocyclic sulphonamides, Bioor & Med Chem Lett 25: 133-41.
- Singh S (2012) A QSAR Study on Novel Series of Carbonic Anhydrase Inhibitors hCA IX—Tumor-Associated (Hypoxia). J Med Chem 8: 656-72.
- Singh S (2009) Comparative QSAR Studies on the Novel Series of Thiazolones and Tetrazole Derivative,s as HCV NS5B Polymerase Allosteric Inhibitors. Lett Drug Des Discov 6: 286- 97.
- Singh S, Supuran CT (2014) 3D-QSAR CoMFA studies on sulfonamide inhibitors of the Rv3588c β-carbonic anhydrase from Mycobacterium tuberculosis and design of not yet synthesized new molecules. J Enzyme InhibMed Chem 29: 449-55.
- Singh S, Shukla P (2011) Modeling of novel HIV-1 protease inhibitors incorporating N-Aryl-oxazolidinone-5-carboxamides as P2 ligands using quantum chemical and topological finger print descriptors. Medicinal Chem Res (BIRKHAUSER) 20: 1556-65.
- Singh S (2011) A Comparative Molecular Field (CoMFA) Studies on Carbonic Anhydrase Inhibitor hCA IX-Tumor-Associated (Hypoxia). Lett Drug Des Discov (Bentham Science) 8: 877-83.
- Singh S (2012) In Silico Modeling of Carbonic Anhydrase Inhibitor hCA IX-Tumor Associated (Hypoxia). Proc Nat Acad Sci India Sect A 82: 113-23.
- Tarko L, Supuran CT (2004) QSAR studies of sulfamates and sulfamide inhibitors targeting human carbonic anhydrase isozymes I,II, IX and XII. Rev Chim (Bucuresti) 55: 539.
- Tarko L (2004) A procedure for virtual fragmentation of molecules into functional groups. ARKIVOC 14: 74-82.
- Eriksson L, Jaworska J, Worth AP, Cronin MT, McDowell RM, et al. (2021) Methods for reliability and uncertainty assessment and for applicability evaluations of classification- and regression-based QSARs. Environ Health Perspect 111: 1361-75.
- Golbraikh A, Tropsha A (2002) Beware of q2! J Mol Graph Model 20: 269-76.
- Osten DW (1998) Selection of optimal regression models via cross‐validation. J Chemom 2: 39-48.
- QSAR Models (2007) Organization for Economic Cooperation and Development, Guidance Document on the Validation of (Quantitative) Structure-Activity Relationship QSAR Models, (2007) OECD Document ENV/JM/ MONO2, USA.
- Worth AP, Aldenberg T, Benjamin I, Cronin MTD (2005) Quantitative Structure Activity Relationships-The Report and Recommendations of ECVAM Workshop 52. ATLA 33: 155-73.
- Tropsha A, Gramatica P, Gombar VK (2003) The importance of being earnest: validation is the absolute essential for successful application and interpretation of QSPR models. Comb Sci 22: 69-77.
- Weaver S, Gleeson MP (2008) The importance of the domain of applicability in QSAR modeling. J Mol GraphModel 26: 1315- 26.
- Melagraki G, Afantitis A (2013) Enalos KNIME nodes: Exploring corrosion inhibition of steel in acidic medium. Chemometrics and Intelligent Laboratory Systems 123: 9-14.
- Xu LZ, Yu GP, Bi WZ, Asia HA (2008) A Quantitative structure – activity relationship study of antifungal analogues of 3-4 substituted 5-(1H,2,4-triazol-1-yl) methyl)-4H-1,2,4- triazole. Structural Chemistry 19: 959-65.
- NCSS (Statistical Software Delux package) (2004) 329 North 1000 East; Kaysville, UT, USA.
- Cook DR (1982) Residuals and Influence in Regression, New York: Chapman and Hall, USA.
Artcle Information
Review Article
Received Date: December 18, 2021
Accepted Date: January 17, 2022
Published Date: January 19, 2022
American Journal of Cancer Research and Oncology
Volume 1 | Issue 1
Citation
Dixit SD, Singh S (2021) Chemometric Modeling and in silico Design of Tumor-Associated Carbonic Anhydrases IX Sulfocoumarins Inhibitors. Am J Cancer Res Oncol 1:1-13
Copyright
©2022 Singh S. This is an open-access article distributed under the terms of the Creative Commons Attribution License, which permits unrestricted use, distribution, and reproduction in any medium, provided the original author and source are credited.

doi: ajco.2021.1.102