

Review Article
Volume-1 Issue-1, 2021
Impact of Hypothyroidism and Lipid Profile on Obesity
Received Date: November 1, 2021
Accepted Date: November 31, 2021
Published Date: December 1, 2021
Journal Information
Abstract
Aims of the Study: The current study aims to determine association of obesity with hypothyroidism, lipid profile and thyroid hormones.
Methods and Materials: Total of 150 samples was collected from obese participants of > 30 BMI. For thyroid profile samples were run on (cobas e411) principle of the Electrogenerated chemiluminescence (ECL) and lipid profile on COBAS c311 on the principle of photometric assays and ion-selective electrode measurements and uses serum/ plasma.
Results: Among study participant 104 (69.3%) were females and 46 (30.7%) were males. The higher prevalence of obesity in female is the indicative risk. Result of chi square test predict; obesity and hypothyroidism P value 0.817, obesity and triglyceride 0.144, obesity and HDL 0.565, obesity and cholesterol 0.204 and obesity and LDL 0.004.
Conclusion: Crystal significant association between obesity and LDL was founded (P-value ≥0.005). No association was observed for other study variables.
Key words
Obesity; Hypothyroidism; TSH; LDL; HDL; TG;Cholesterol
Variables |
Frequency(%) |
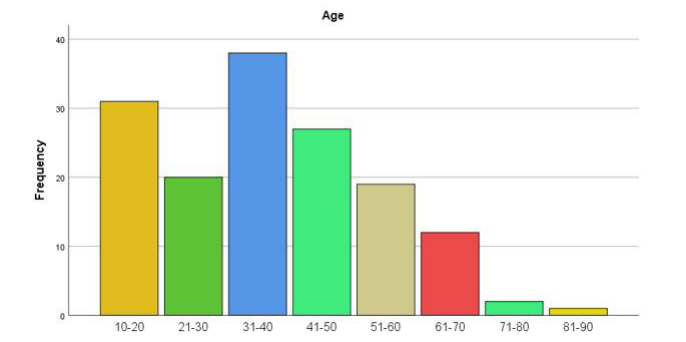
Age |
|
10-20 |
31 (20.7%) |
21-30 |
20 (13.3%) |
31-40 |
38 (25.3%) |
41-50 |
27 (18.0%) |
51-60 |
19 (12.7%) |
61-70 |
12 (8.0%) |
71-80 |
2 (1.3%) |
81-90 |
1 (0.7%) |
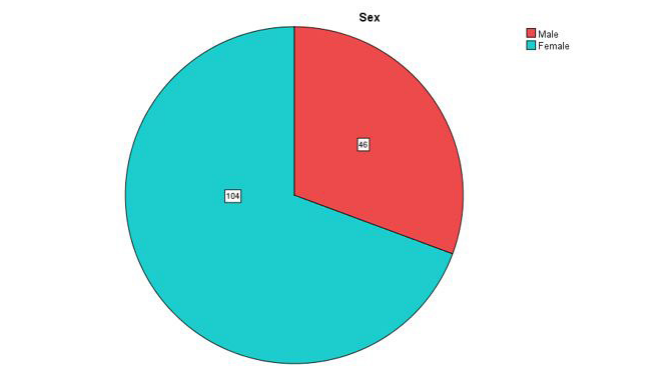
Sex |
|
Male |
46 (30.7%) |
Female |
104 (69.3%) |
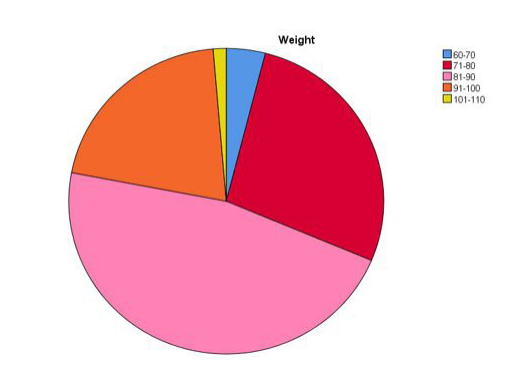
Weight |
|
60-70 |
6 (4%) |
71-80 |
41 (27.3%) |
81-90 |
70 (46.7) |
91-100 |
31 (20.7) |
101-110 |
2 (1.3%) |
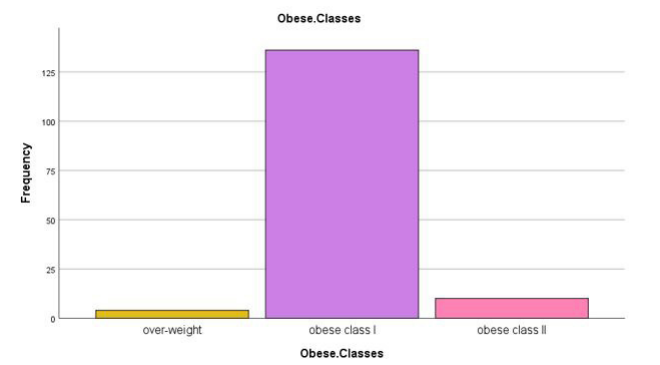
ObeseClass |
|
Over-Weight |
4 (2.7%) |
Obese Class I |
136 (90.7%) |
Obese Class II |
10 (6.7%) |
Obese Classes |
Fast Food |
Total |
||||
Zinger |
Pizza |
Chinese soup |
Others |
No |
||
over-weight |
1 |
0 |
0 |
0 |
3 |
4 |
obese class I |
24 |
20 |
6 |
1 |
85 |
136 |
obese class II |
1 |
0 |
0 |
0 |
9 |
10 |
Total |
26 |
20 |
6 |
1 |
97 |
150 |
Obese Classes |
Rice consumption |
Total |
||||
1-2 times a week |
2-3 times a week |
4-5 times a week |
4-8 times a month |
No |
||
over-weight |
1 |
1 |
1 |
0 |
1 |
4 |
obese class I |
47 |
47 |
14 |
7 |
21 |
136 |
obese class II |
5 |
3 |
1 |
0 |
1 |
10 |
Total |
53 |
51 |
16 |
7 |
23 |
150 |
Obese Classes |
Diet |
Total |
||
Veg |
Non-Veg |
Both |
||
over-weight |
1 |
0 |
3 |
4 |
obese class I |
12 |
3 |
121 |
136 |
obese class II |
0 |
0 |
10 |
10 |
Total |
13 |
3 |
134 |
150 |
Obese Classes |
Routine daily exercise |
Total |
|||
walk / running |
home workouts |
strenuous activities |
No |
||
over-weight |
0 |
1 |
1 |
2 |
4 |
obese class I |
36 |
18 |
3 |
78 |
136 |
obese class II |
1 |
2 |
0 |
7 |
10 |
Total |
37 |
21 |
4 |
87 |
150 |
Obese Classes |
Other complications |
Total |
||||
Frequent infection |
arthritis |
back pain |
others |
No |
||
over-weight |
0 |
2 |
0 |
0 |
2 |
4 |
obese class I |
10 |
21 |
27 |
17 |
61 |
136 |
obese class II |
1 |
5 |
2 |
0 |
2 |
10 |
Total |
11 |
28 |
29 |
17 |
65 |
150 |
Obese Classes |
Education |
Total |
||||
Illiterate |
SSC |
F. Sc |
Bachelor |
M.Phil./ PhD |
||
over-weight |
3 |
1 |
0 |
0 |
0 |
4 |
obese class I |
77 |
23 |
24 |
8 |
4 |
136 |
obese class II |
8 |
1 |
1 |
0 |
0 |
10 |
Total |
88 |
25 |
25 |
8 |
4 |
150 |
Obese Classes |
Hypothyroidism |
Total |
P.Value |
|
Yes |
No |
|||
over-weight |
0 |
4 |
4 |
.817 |
obese class I |
11 |
125 |
136 |
|
obese class II |
1 |
9 |
10 |
|
Total |
12 |
138 |
150 |
|
Obese Classes |
Triglyceride |
Total |
P. Value |
||
100-150 |
151-200 |
201-250 |
|||
over-weight |
0 |
4 |
0 |
4 |
.144 |
obese class I |
17 |
91 |
28 |
136 |
|
obese class II |
1 |
4 |
5 |
10 |
|
Total |
18 |
99 |
33 |
150 |
|
Obese Classes |
Cholesterol |
Total |
P. Value |
||
151-200 |
201-250 |
251-300 |
|||
over-weight |
0 |
2 |
2 |
4 |
.204 |
obese class I |
11 |
76 |
49 |
136 |
|
obese class II |
3 |
4 |
3 |
10 |
|
Total |
14 |
82 |
54 |
150 |
|
Obese Classes |
LDL |
Total |
P. Value |
||
50-100 |
101-150 |
151-200 |
|||
over-weight |
3 |
0 |
1 |
4 |
0.004 |
obese class I |
100 |
34 |
2 |
136 |
|
obese class II |
10 |
0 |
0 |
10 |
|
Total |
113 |
34 |
3 |
150 |
|
Obese Classes |
HDL |
Total |
P. Value |
|||
20-30 |
31-50 |
51-70 |
71-90 |
|||
over-weight |
1 |
3 |
0 |
0 |
4 |
.565 |
obese class I |
16 |
68 |
46 |
6 |
136 |
|
obese class II |
1 |
3 |
5 |
1 |
10 |
|
Total |
18 |
74 |
51 |
7 |
150 |
|
 |
| Figure 1: Prevalence of underweight, normal, overweight, and obese individuals based on BMI (A) Overall prevalence between different categories (p = 0.033); (B) Prevalence among males and females (p = 0.041); (C) Prevalence within age groups, 18-22, 23-27, and 28-32 years (p = 0.006) |
 |
| Figure 2: Assessment of abdominal obesity based on WC and W/H ratios (A) Proportion of individuals with normal and abnormal WCs across different categories based on BMI (p < 0.001); (B) Proportion of males and females with abnormal WC; (C) Proportion of individuals with normal and abnormal W/H ratios across different categories based on BMI (p < 0.001); (D) Proportion of males and females with abnormal W/H ratios |
 |
| Figure 3: Hypertension prevalence and sleep duration (A) Proportion of individuals with hypertension across different categories (p < 0.001); (B) Proportion of individuals based on their sleep duration across different categories (p < 0.001) |
 |
| Figure 4: High fat/sugar diet and smoking habit among different categories (A) Overall proportion of individuals consuming high fat/sugar diet across different categories (p = 0.246); (B and C) Proportion of males and females consuming high fat/sugar diet (p = 0.494 & p = 0.035, respectively); (D) Overall proportion of individuals based on their smoking habit (p = 0.001); (E and F) Proportion of males and females based on their smoking habit (p = 0.016 & p = 0.405, respectively). |
Introduction
Obesity is one of the most salient healths Risk of all time. The prevalence of obesity has increased worldwide since the mid1970s. According to the report of National Health and Nutrition Examination Survey, obesity affected 32.2% of adults in 2003– 2004. Obesity is associated with an increased risk of diabetes, dyslipidemia, kidney disease, cardiovascular disease, all-cause mortality, and cancer [1,2].
A BMI of at least 30 is currently generally acknowledged as obesity. Overweight denotes the presence of extra body weight. Obesity denotes the presence of extra deposited fats. Every single obese individual is overweight; however, all overweight people are not obese as overabundant body weight may emerge from muscles [3]. The mechanisms regulating body weight are complex, stimulated by various factors: physiological, societal, environmental, genetic and behavioral. None of those is understood at the individual degree, dietary, metabolic, hormonal and neuronal alerts are incorporated inside the brain to produce modifications in behavior (eating, physical activity) and body metabolism [4-7].
Obesity, particularly central obesity, is related to many endocrine abnormalities, such as thyroid disorder [8].
Thyroid disorder is associated with modifications in body weight and composition, body temperature, and total resting energy expenditure independently of physical hobby. Both subclinical and overt hypothyroidism are often related to weight gain [9,10].
Hypothyroidism is associated with reduced thermogenesis, decreased metabolic rate, and has additionally been shown to correlate with a higher body mass index (BMI). There is medical evidence suggesting that even slight thyroid disorder is linked to considerable modifications in body weight and represents a hazardous aspect for overweight and obesity [11]. An Indian study having sample size of 450 showed that among the obese, 33% had overt, and 11% had subclinical hypothyroidism [12,13].
Fat cells active endocrine organs because they produce leptin. The correlation among TSH and BMI might be mediated through leptin. Energy homeostasis is regulated by leptin through informing the brain about fat reserves.
Leptin is likewise a crucial neuroendocrine regulator of the hypothalamic-pituitary-thyroid axis through regulation of TRH gene expression within the paraventricular nucleus, and TSH in turn will stimulate leptin secretion through human adipose tissue. Leptin additionally influences thyroid deiodinase activities with activation of T4 to T3 [14].
Extreme obesity is related to thyroid disorder because of HPTA anomaly inflicting elevated TSH. Body weight and serum TSH are linked by signals from adipose tissues. TRH is immediately released in the paraventricular nucleus of neurons by stimulation of leptin produced by adipose tissues thus increasing TSH level [15]. The negative feedback among TSH and TRH is decreased in obesity due to reduced T3 receptors [16-18].
Thyroid hormones drastically affects lipoprotein metabolism and risk factors of CVD, thus enhancing overall CVD risk [19,20]. Even with the slight increase in TSH levels a linear increase in Cholesterol, LDL, TG, and decrease in HDL have been observed [21].
The literature is still deficient that either a correlation exits among hypothyroidism and obesity. Further, there is clear study conducted yet to find association between lipid profile and thyroid hormones in obese patients. Therefore, this study is conducted to determine the association of obesity with hypothyroidism and lipid profile.
Materials and Methods
Study design and Study sites
Cross-sectional Analytical study was conducted in khyber medical university Peshawar. A total of 150 patients with >30BMI and no CVD were included in the study. The Study was carried out in Multi Healthcare center (Lady Reading Hospital, Khyber Teaching Hospital and Hayatabad Medical Complex) in Peshawar.
The study was approved from the institutional review board of Institute of Paramedical Sciences, Khyber Medical University.
Sampling Technique and procedure
Blood samples were collected in a yellow top Gel Tube (Clot activator) from B.D Company from the patients of multi health care centers Peshawar through convenient sampling. The samples were labeled with Medical record numbers of concern hospitals. Serum Samples of thyroid profile were run on COBAS e411 of Electro generated chemiluminescence (ECL) principal and for lipid profile samples were run on the COBAS c311 of photometric assays and ion-selective electrode measurements principle and uses serum/plasma.
The data was analyzed using SPSS. For descriptive statistics cross tabulation was done between different variables and for inferential statistics Chi-square test was performed.
Results
150 Obese participants were screened for our key variables i.e thyroid profile & lipid profile. These result show the high number of female obese participant which may be due to their home life style of that particular regions.
Age and GENDER wise distribution of Participants
150 patients having 104 (69.3%) females and 46 (30.7%) males. The most prevalent age group is 31-41years.which need further assessment. Age groups 10-20 years were the more prevalent group among obese study participants.
Following Table 1 and Figure 1 shows the frequency and percentage of the said variables.
Following Table 1 and Figure 2 shows the frequency and percentage of said variables.
Weight wise distribution
71-80 kg was observed among 41 (27.3%) study subjects. The lowest Wight of obesity is 60-70 which indicate alternative reason that small height participant have low chance of obesity. Following Table 1 and Figure 3 shows the frequency and percentage of said variables.
Obese class distribution
Obese class 1 is the main obesity found in our study 136 (90.7%) while other classes of obesity have low prevalence (Table 1 and Figure 4).
Obese class and fast food consumption
It was seen that the fast food consumption among obese classes was high in class 1 obese which is the man age where people want go outside and eat as shown in Table 2a.
Obese class and rice consumption
It was seen that rice consumption have association with obesity. So proper intake of rice should be preferred in obese person Table 2b.
Obese class and Diet
It was seen that both Veg and Non-Veg was the major meal plan among obese classes. But these results are against the natural and need to be verifying by the comparison of other food in relevant to vegan (Table 3).
Obese class and Routine daily
ExerciseMild exercise was observed among obese classes Mild exercise is not enough to overcome the obesity so you need to be more active to be non-obese (Table 4).
Obese class and Other Complications
Arthritis, back pain, and other complications such as weak eye sight, generalized weakness, were seen among obese classes which indicate obesity is related with other health risk factor and outcome (Table 5).
Obese class and Education
It was observed that most of the obese participants were illiterate which indicate our society need obesity related social work about their harmful impact on health (Table 6).
Obese class and Hypothyroidism
It was observed in our study that there was no association between obesity and hypothyroidism, P value 0. 817 (Table 7).
Obese class and Triglyceride
It was observed in our study that there was no association between obesity and Triglyceride P value 0.144 (Table 8).
Obese class and Cholesterol:
It was observed in our study that there was no association between obesity and Cholesterol P value 0.204 (Table 9).
Obese class and LDL
It was observed in our study that there was an clear association between obesity and LDL. P value 0.004. There was an increase in serum LDL among obese classes (Table 10).
Obese class and HDL
It was observed in our study that there was no association between obesity and HDL. P value 0.565 (Table 11).
Discussions
Very limited literature exists on the association of obesity with hypothyroidism and lipid profile, especially in Pakistan and specifically in Khyber Pakhtunkhwa, therefore this study is aimed to determine the association between obesity and hypothyroidism with lipid profile.
There was a clear association between obesity and LDL P value 0.004, as LDL was increased in participants In our study it was observed that there was no association between obesity and hypothyroidism P value 0.817 furthermore it was observed there was no association between obesity and Triglyceride, HDL, and cholesterol, P value 0.144,0.565, 0. 204.. The higher prevalence of obesity in females is indicative risk and reason behind their obesity.
In a study by Abhyuday Verma, MD, Muthu Krishnan Jayaramanit was shown that there is an association between obesity and hypot*hyroidism p value 0.02. Their sample size was 1075 individuals and had a control group of 450individuals. In their study the group 1 had625 individuals in which 44% had BMI of >25. They observed that in obese individuals there was a high prevalence of hypothyroidism 33% and 11% had subclinical hypothyroidism.Detail studies are required to assess the cause and effect relationship between obesity and hypothyroidism [13].
In a study by Okan et al, it was shown that there was no association between obesity and hypothyroidism. Their sample size was 947 and had a control group of 50 individuals [22-25]. They had 4 groups which were based on circumference and BMI and showed a positive relation between BMI, circumference and body fat percentage P value 0.001 [26-28]. They compared all the 4 groups with the control group for serum TSH levels and found no significance in the control group and the other 4 groups P value 0.34, 0.69 0.12 and 0.47 respectively [29,30].
In a study by Debmalya Sanyal and Moutusi Raychaudhuri showed no clear association between obesity and Hypothyroidism and stated that further research is necessary to determine whether hypothyroidism is one of the cause of obesity [12].
The difference in results of our study and other study is because most of the studies had a wide sample size average 900+ as compared to our study it was 150 individuals. Most importantly these studies had a control group where as in our study there was no control group due to limited resources. These studies were conducted mostly in the Endocrinology Department of Hospitals therefore they had referral biasedness in their results. These studies had advance equipment’s that can detect free thyroid hormones while we had no such facilities to do so. These studies were conducted for a long duration such as 2-3 years while our study was conducted for 2 months only. These studies were mostly retrospective while our study was cross sectional [31-35].
Conclusion
Association between obesity and LDL P value 0.004 is the outcome of the study and need an point eye on the food which is the main reason of LDL in food intake of daily life.
References
- World Health Organization WHO (2000) Obesity: preventing and managing the global epidemic, Geneva, Sweden.
- Golden SH, Robinson KA, Saldanha I, Anton B, Ladenson PWJTJoCE (2009) Metabolism. Prevalence and incidence of endocrine and metabolic disorders in the United States: a comprehensive review 94: 1853-78.
- World Health Organization WHO (2000) The Asia-Pacific perspective: redefining obesity and its treatment: Sydney: Health Communications Australia.
- World Health Organization WHO (1998) Obesity: preventing and managing the global epidemic: report of a WHO consultation on obesity, Geneva, Sweden.
- Kumanyika SK (1993) Special issues regarding obesity in minority populations 119: 650-4.
- Hodge AM, Zimmet PZJB (1994) Metabolism In: The epidemiology of obesity 8: 577-99.
- Nanan DJJ (2002) The obesity pandemic-implications for Pakistan 52: 6-11.
- Biondi B (2010) Thyroid and obesity: an intriguing relationship, Oxford University Press, UK.
- Hoogwerf BJ, Nuttall FQJTA (1984) Long-term weight regulation in treated hyperthyroid and hypothyroid subjects 76: 963-70.
- Åsvold BO, Bjøro T, Vatten LJ (2009) Metabolism. Association of serum TSH with high body mass differs between smokers and never-smokers 94: 5023-7.
- Danforth E, Horton E, O'Connell M, Sims E, Burger A, et al. (1979) Dietary-induced alterations in thyroid hormone metabolism during overnutrition 64: 1336-47.
- Sanyal D, Raychaudhuri MJ (2016) Metabolism Hypothyroidism and obesity: An intriguing link 20: 554.
- Rosenbaum M, Hirsch J, Murphy E, Leibel RL (2000) Effects of changes in body weight on carbohydrate metabolism, catecholamine excretion, and thyroid function 71: 1421-32.
- Verma A, Jayaraman M, Kumar HK, Modi KD (2008) Hypothyroidism and obesity. Cause or effect? 29: 1135-8.
- Thompson GR, Soutar AK, Spengel FA, Jadhav A, Gavigan S, et al. (1981) Defects of receptor-mediated low density lipoprotein catabolism in homozygous familial hypercholesterolemia and hypothyroidism in vivo. 78: 2591-5.
- Seppel T, Kosel A, Schlaghecke RJ (1997) Bioelectrical impedance assessment of body composition in thyroid disease 136: 493-8.
- Pinkney JH, Goodrick SJ, Katz J, Johnson AB, Lightman SL, et al. (1998) Leptin and the pituitary–thyroid axis: a comparative study in lean, obese, hypothyroid and hyperthyroid subjects 49: 583-8.
- Wolf M, Weigert A, Kreymann GJ (1996) Body composition and energy expenditure in thyroidectomized patients during short-term hypothyroidism and thyrotropin-suppressive thyroxine therapy 134: 168-73.
- Burman KD, Latham KR, Djuh Y-Y, Smallridge RC, Tseng Y-CL, et al. (1980) Solubilized nuclear thyroid hormone receptors in circulating human mononuclear cells 51: 106-16.
- Mihály E, Fekete C, Tatro JB, Liposits Z, Stopa EG, et al. (2000) Hypophysiotropic thyrotropin-releasing hormonesynthesizing neurons in the human hypothalamus are innervated by neuropeptide Y, agouti-related protein, and α-melanocytestimulating hormone 85: 2596-603.
- Blum WF, Englaro P, Attanasio AM, Kiess W, Rascher WJ (1998) Human and clinical perspectives on leptin 57: 477-85.
- Tangkilisan AH, Akune KJPI (2007) Some factors related to lipid profile in obese children at junior high schools in Manado 47: 166-71.
- Teixeira PJ, Sardinha LB, Going SB, Lohman TG (2001) Total and regional fat and serum cardiovascular disease risk factors in lean and obese children and adolescents 9: 432-42.
- Duntas LHJT (2002) Thyroid disease and lipids 12: 287-93.
- Canaris GJ, Manowitz NR, Mayor G, Ridgway EC (2000) The Colorado thyroid disease prevalence study. 160: 526-34.
- Åsvold BO, Vatten LJ, Nilsen TI, Bjøro TJ (2007) The association between TSH within the reference range and serum lipid concentrations in a population-based study. The HUNT Study 156: 181-6.
- Bakker O, Hudig F, Meijssen S, Wiersinga WMJB (1998) Effects of triiodothyronine and amiodarone on the promoter of the human LDL receptor gene 249: 517-21.
- Shin D-J, Osborne TF (2003) Thyroid hormone regulation and cholesterol metabolism are connected through sterol regulatory element-binding protein-2 (SREBP-2) 278: 34114-8.
- Faure P, Oziol L, Artur Y, Chomard PJB (2004) Thyroid hormone (T3) and its acetic derivative (TA3) protect low-density lipoproteins from oxidation by different mechanisms 86: 411-8.
- Iglesias P, Díez JJJC (2007) Influence of thyroid dysfunction on serum concentrations of adipocytokines. 40: 61-70.
- Rizos C, Elisaf M, Liberopoulos EJ (2011) Effects of thyroid dysfunction on lipid profile 5: 76.
- Richter MM (2004) Electrochemiluminescence (ecl) 104: 3003-36.
- Diagnostics Roche (2001) CRcT Cobas e 411 analyser, Ltd, USA.
- Tansley B (1998) Photometric measurement apparatus, Google Patents, USA.
- Bakiner O, Bozkirli E, Cavlak G, Ozsahin K, Ertorer EJ (2014) Are plasma thyroid-stimulating hormone levels associated with degree of obesity and metabolic syndrome in euthyroid obese patients? A Turkish cohort study.
Artcle Information
Review Article
Received Date: November 1, 2021
Accepted Date: November 31, 2021
Published Date: December 1, 2021
Journal of Obesity and Complications
Volume 1 | Issue 1
Citation
Shams UA, Karim WA, Khattak A, Zeb A, ul Haq F, et al. (2021) Impact of Hypothyroidism and Lipid Profile on Obesity. J Obes Comp 1: 1-11
Copyright
©2021 Muhammad N. This is an open-access article distributed under the terms of the Creative Commons Attribution License, which permits unrestricted use, distribution, and reproduction in any medium, provided the original author and source are credited.

doi: joc.2022.1.101