

Review Article
Volume-1 Issue-1, 2025
Predictive Model of The Dose to The Heart Based on Geometry Evaluation in Left Breast Radiotherapy
-
Received Date: January 04, 2025
-
Accepted Date: January 23, 2025
-
Published Date: January 30, 2025
Journal Information
Abstract
Purpose: radiotherapy treatment plan of the left breast can be critical due to the heart proximity. Thus, conservative dose constraints for limiting the mean heart dose (MHD) have been suggested in order to minimize late complications. In this paper, a predictive model is developed to correlate MHD to the treatment geometry.
Methods: To quantify the geometric arrangement, a target expansion and overlap procedure was applied following the Expansion Intersection Histogram (EIH) method. This procedure operates by progressive target isotropic expansions and mapping the corresponding volume intersection relative to the heart into the EIH graph. From this graph the separation (S, min non zero overlap expansion) and wrapping, (W, mean EIH slope between S and 3 cm away from S) are extracted as input parameters of a multivariate linear regression model along with omolateral breast volume (OBV).
Results: Nineteen breast cancer patients were considered in this study. All cases were subjected to a treatment course of 15 fractions with a breast dose of 40.5 Gy and a 48 Gy simultaneous integrated boost (SIB) planned with volumetric modulated arc therapy (VMAT). Descriptive statistics (Mean±SD) was found to be 1.21±0.41 cm, 8.25±3.33 %/ cm and 708.13±388.64 cc for S, W and OBV, respectively. MHD was 3.25±0.78 Gy. The R2 of the model was 0.9. Regression β resulted as -0.468±0.202, -11.831±1.851 and 0.058±0.015 for S,1/w and √OBV with the last two variables transformed to approach a Gaussian distribution. All input parameters were significant MHD predictors (p< 0.05).
Conclusions: We developed a statistical multivariate model aiming to relate MHD to a specific description of the relevant geometrical layout of the volumes involved in a complex VMAT radiotherapy treatment of the left breast. Unlike previous publications, geometric features were obtained from the available RT structure set using the expansion and overlap method. With an R2 = 0.9, the statistical significance of the model was very high. As expected, our model assigns an increase in MHD for targets closer and more wrapped around the heart. Data are preliminary, but, if confirmed and validated in a larger series, this procedure could be used to predict potential heart damage and assist in the choice of an appropriate technique for left breast irradiation, such as breath hold or other suitable heart sparing techniques.
Taxonomy (according to the new taxonomy, xlsx file): 17.7 Classification methods – 34.5 Machine learning – 18.20 Feature extraction and texture analysis
Key words
Predictive Model; Multivariate Analysis; Left Breast; Radiotherapy; VMAT
Characteristic |
specification |
Body site |
Left breast |
Number of fractions |
15 |
Whole breast total dose |
40.5 Gy |
Boost total dose |
48 Gy |
Technique |
Free Breathing VMAT, 2 or 4 arcs |
beam photon energy |
6 MV |
Variable |
Mean ± SD |
Min – Max |
MHD |
3. 25 ± 0.78 Gy |
1.65 - 4.47 Gy |
OBV |
708.13 ± 388.64 cc |
146.32 - 1649.40 cc |
S |
1.21 ± 0.41 cm |
0.40 - 1.80 cm |
W |
8.25 ± 3.33 %/cm |
4.43 - 20.86 %/cm |
variable |
Coefficient (β) |
SE |
95% CI |
t |
p Value |
|
0.058 |
0.015 |
0.026 - 0.090 |
3.93 |
0.001 |
S |
-0.468 |
0.202 |
-0.902 - -0.035 |
-2.332 |
0.036 |
1/ |
-11.831 |
1.851 |
-15.801 - -7.861 |
-6.39 |
<< 0.01 |
*, variable transformed to approach a Gaussian distribution
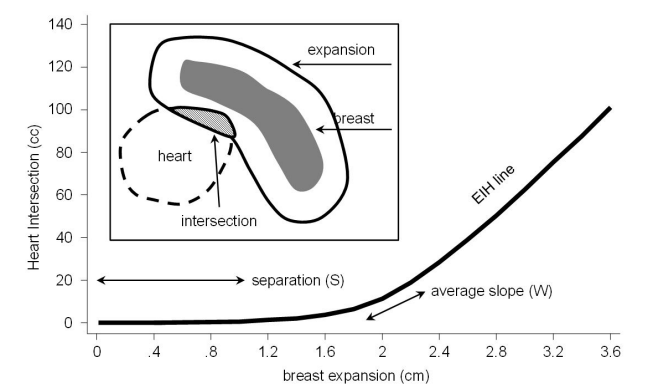 |
| Figure 1: Typical EIH diagram for the heart. Insert: dashed line, heart surface; dark grey area, breast volume; solid line around breast, target expansion; dashed area, intersection between heart and expanded target. Separation (S), distance between heart and target. Wrapping (W), average slope of the EIH plot. EIH slope is evaluated as the heart volume overlap per cm of target expansion |
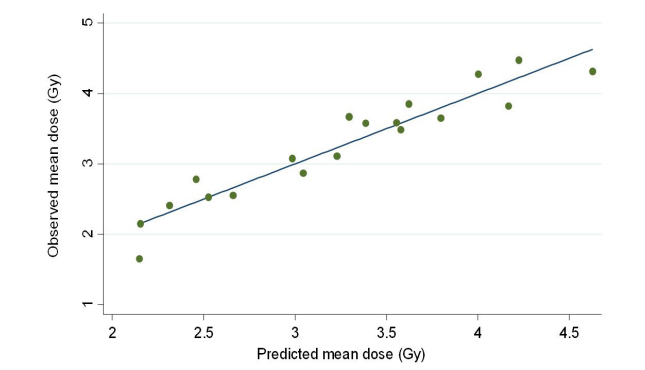 |
| Figure 2:Observed versus predicted MHD in a multivariate regression model for 19 patients. R2 was found to be 0.90. The fit was highly significant, with p << 0.01 |
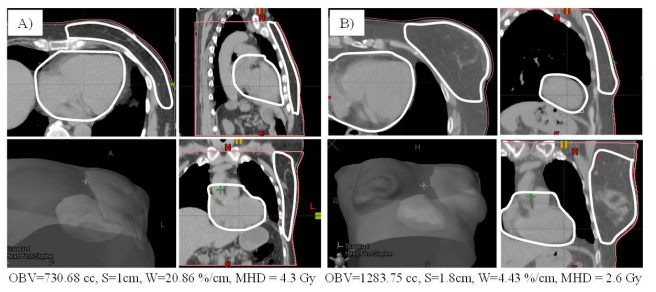 |
| Figure 3: geometrical configuration of anatomical structures for two different patients A) and B). Omolateral breast and heart boundaries are shown in white for planar images and in gray for 3D representations. Predicted MHD was 4.6 and 2.7 Gy for patient A) and B), respectively |
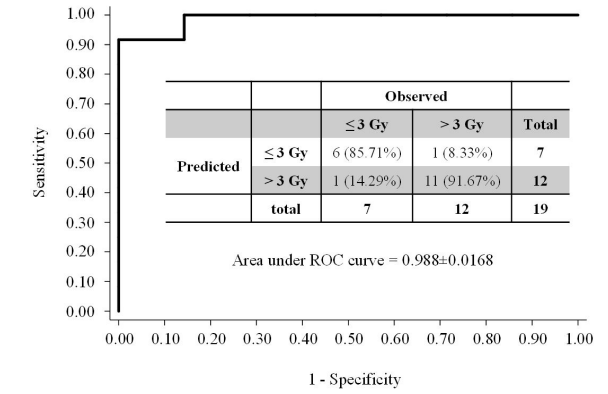 |
| Figure 4: Representation of the discriminating power of the predictive model. Classification according to predicted MHD ≤ 3 Gy or > 3 Gy. Sensitivity = 91.67%, specificity = 85.71% |
Introduction
The number of breast cancer survivors is increasing as a result of rising incidence, earlier diagnosis, and better treatment results. Although the outcome for these patients is improved by adjuvant radiotherapy, radiation itself has the potential to increase the risk of RT-induced cardiac toxicity with a negative impact on health-related quality of life. For this reason, conservative dose constraints e. g., with mean dose to the heart (MHD) lower than 4 Gy have been suggested to minimize late effects [1,2]. Specific techniques, especially those exploiting respiratory gating, have been demonstrated to be effective tools to reduce the dosimetric impact of radiation therapy, especially for left breast treatments [3-7]. Evaluation tools have also been provided to associate patients to specific cardiac risk classes and/or to assist radiation oncologists in the choice of a proper treatment technique for breast irradiated patients. Some of the mentioned tools rely on geometrical assessments of the heart position relative to the target [8-11].
In this work a model is developed able to correlate MHD in left breast VMAT irradiation to a specific geometrical assessment of the treatment area based on the Expansion Intersection Histogram method [12]. Once validated, this model could be used in this therapy to predict MHD and to assist the radiation oncologist in choosing suitable dose reduction strategies, such as breath hold techniques, for unfavorable geometries.
Materials and methods
Patients were randomly selected among those included in our hypofractionation protocol [13]. The main characteristics and features selected for treatment planning are summarized in Table 1.
Contouring was performed by a Radiation Oncologist expert in the breast pathology following international guidelines [14]. Contour handling, including volume expansion, Boolean operators and all image processing was realized with the Varian Eclipse software suite (Varian Medical Systems, Palo Alto, CA).
To quantify the relevant features able to describe the geometric arrangement of inner organs involved in the radiotherapy treatment, a target expansion and overlap procedure was applied following the Expansion Intersection Histogram (EIH) method [12]. This procedure operates by progressive target isotropic expansions and mapping the corresponding intersection volume with the organ at risk (the heart), into the EIH graph. From this graph, the Separation, S, (minimum non zero overlap expansion) and Wrapping , W, (mean EIH derivative) are extracted as meaningful geometrical descriptors of the therapy setting. As an example, a typical EIH is shown in Figure 1. To allow a standardized comparison among all patients, W is calculated as relative overlap normalized to the heart volume within an expansion interval between S and 3 cm away from S.
The aim of the Wrapping (W) parameter is to quantify how heart and breast are facing each other, or, in other words, how much heart is “surrounded” by the breast surface. The greater this alignment between the two surfaces, the steeper the EIH curve with larger Ws. The omolateral breast volume (OBV) was also included to complete the description. The Number of Arcs used for the treatment was inserted in the model as a control variable to adjust for treatment modality.
Variables S, W and OBV were tested in order to find possible transformations able to better approach a Gaussian distribution. This goal was achieved by using the “ladder” command of the Stata software (Stata 15.1, StataCorp, College Station, USA), able to search a subset of the ladder of powers for a transform that converts the original data into normally distributed variables according to Tukey [15].
The above software was used for all statistical analyses and evaluations in this work.
After this processing, all parameters were used as input arguments for a multivariate linear regression with MHD as the dependent variable.
Results
Nineteen patients considered for treatment in our facility and enrolled in our hypofractionation protocol were selected for this study. All the previously described geometrical indicators were evaluated for each patient. Treatments were planned according to dose prescriptions in Table 1 and MHD calculated, accordingly. A summary of descriptive statistics is reported in Table 2. Of the 19 patients, six were planned using two arcs.
Two variables, i. e., OBV and W, were transformed into √OBV and and 1/w to approach a normal distribution. The other variable, S, was not modified. After transformation, all variables did not show any significant deviation from normality (p> 0.05 by a χ2.test).
With this so modified input data set, multivariate linear regression results are reported in Table 3.
The linear fit was highly significant (p<< 0.01) with an R 2 of 0.90. For a visual representation of the model ability to fit data, a plot of observed versus predicted MHDs is shown in Figure 2
Discussion and Conclusions
Although preliminary, our results help us to better clarify the connection between MHD and the geometric layout involved in the radiotherapy treatment of the left breast in a context of a homogeneous setting of both technique and dose prescriptions. Our geometrical analysis is simple, but not trivial. In particular, the wrapping parameter, W, proved to grasp some aspects of the spatial arrangement of radiotherapy volumes relevant for their impact on heart dosimetry. Nevertheless, W, as well as the other parameters in the model can be easily calculated using standard tools integrated in all commercial TPSs. In order to visualize the descriptive power of our parameters in comparing different patients, an example is pictured in Figure 3. It is apparent from the figure the ability of S and W to describe a more challenging geometry for patient A) having the heart closer to the irradiated breast (with a smaller S) and for a much larger extent of its surface (larger W). This can explain why MHD is lower for patient B), in spite of the bigger target volume.
The spatial arrangement of organs in the body as well target sizes as described in Table 2 seems to be realistic, i. e., to reasonably reflect the behavior of the general population.
With an R2 equal to 0.90 (Figure 2) and considering that all regression coefficients have p-values below 0.05, most of them around or well below 0.01 (Table 3), we have a high overall statistical significance of our model. However, further considerations are required to better describe the meaning of the different regression betas in so far as they can explain the impact of our geometrical variables on MHD.
The interpretation of the β coefficient for S in Table 3 is straightforward, assigning an average decrease of 0.47 Gy in MHD for each cm of increase in separation between heart and irradiated breast.
Unfortunately, a same direct quantification of the dosimetric impact of OBV and W is impossible because these variables were subjected to nonlinear transformations. Nevertheless, data in Table 3 indicate, as expected, a significant MHD increment for bigger targets (large OBVs), especially when wrapped around the heart (large Ws).
Of course, an estimation of the model dependence on both OBV and W is still possible, by direct input, even though sensitivity depends on the parameters range. By simply calculating MHD variation through our model per unit change of OBV and W around specific selected values, a sensitivity of about 1 mGy for each added cc of target can be estimated in a OBV range between 400 and 1000 cc, whereas an increase of 0.48, 0.19 and 0.12 Gy per unit increment of W can be estimated around 5, 8 and 10 %/cm.
After the fundamental paper of Darby in 2013 [1], other more sophisticated studies have been carried out to better evaluate cardiac toxicity in an updated context of the radiotherapy practice. Although these studies suggested even better heart toxicity predictors than MHD [2], they confirmed the fundamental role of this metric that is still considered as a comparative gold standard [3-5].
Correlation between heart exposure and patient geometric inner organ arrangement is a topic already covered in the literature for left side breast irradiation, with particular focus on predictive factors or surrogates for MHD. Generally, this geometric assessment uses the distance between heart and irradiated breast [9,8,11] or refers to the extent of the contact surface between heart and relevant regions of the chest wall [10]. Such indicators are derived using basic methods reminiscent of specific treatment techniques, such as tangential opposed beams.
Our method offers a more comprehensive view of the whole area of interest with data that can be potentially collected by fully automated scripting procedures. Moreover, here the distance, S is conceptually separated by the shape parameter, W, since it is computed as the slope of EIH, beyond the S position.
Since our results indicate W as the most significant predictor of MHD (Table 3), it seems like this variable is able to capture a qualitative visual perception (i. e., to what extent the heart is surrounded by the target) effectively quantified into a single numeric variable.
To show the potential discriminating power of our model in a classification problem, as an exercise, we can also split our patient population into two ≤ 3 Gy and > 3 Gy MHD reference classes. Classification based on predicted MHD may support a decision to address the patient, for example, towards a DIBH treatment, once associated to the high risk group (> 3Gy MHD) according to our model. The corresponding classification statistics and ROC curve obtained in this case is reported in Figure 4, where very promising values for sensitivity (91.67%), specificity (85.71%) and Area Under ROC Curve (0.988) are shown.
Although established, the correlation discussed above between MHD and our variable set should be internally validated in a larger series and also externally tested, using cases different from the ones used for model instruction before using it as a predictor or classification tool. If confirmed, our results could be used to predict MHD and may be exploited as a useful guidance for clinicians to address patients, when necessary, to optimal implementation of heart-sparing RT.
In conclusion, we developed a statistical multivariate model to relate MHD to specific features aiming to describe the geometrical setting of the volumes involved in a complex VMAT radiotherapy treatment of the left breast. The significance of the model was high (p<< 0.01), with an R2 above 0.9 and p-values for all β below 0.05. As could reasonably be expected, our model assigns an increase in MHD for targets closer and more wrapped around the heart. This effect is quantified in a decrease of about 0.47 Gy for each added cm of separation between heart and breast and a MHD increment between 0.48 and 0.12 Gy for every unit rise in average EIH slope (% of heart overlap per cm of target expansion). Breast volume was found to be responsible for a higher MHD to an extent of about 1 mGy per added target cc. Our preliminary data show a potential to effectively classify a patient into the high risk MHD group so that she can be directly addressed to a specific heart sparing treatment. Work is in progress to validate our method in a larger series.
Conflict of Interest
The authors have no relevant conflicts of interest to disclose.
References
- Darby SC, Ewertz M, McGale P (2013) Risk of ischemic heart disease in women after radiotherapy for breast cancer. N Engl J Med 368: 987-98.
- Van Den Bogaard VAB, Ta BDP, Van Der Schaaf A (2017) Validation and Modification of a Prediction Model for Acute Cardiac Events in Patients with Breast Cancer Treated With Radiotherapy Based on Three-Dimensional Dose Distributions to Cardiac Substructures 11: 1171-8.
- Hong JC, Rahimy E, Gross CP (2018) Radiation dose and cardiac risk in breast cancer treatment: An analysis of modern radiation therapy including community settings Practical Radiation Oncology 8: e79-e86
- Berg M, Lorenzen EL, Jensen I (2018) The potential benefits from respiratory gating for breast cancer patients regarding target coverage and dose to organs at risk when applying strict dose limits to the heart: results from the DBCG HYPO trial. 2018, Acta Oncologica 57: 113-9.
- Drost L, Yee C, Lam H (2018) Systematic Review of Heart Dose in Breast Radiotherapy. 2018. Clinical Breast Cancer, 5: e819-24
- Eldredge-Hindy H, Lockamy V, Crawford A (2015) Active Breathing Coordinator reduces radiation dose to the heart and preserves local control in patients with left breast cancer: Report of a prospective trial. 2015, Practical Radiation Oncology 5: 4-10.
- Pierce LJ, Feng M, Griffith KA (2017) Recent Time Trends and Predictors of Heart Dose From Breast Radiation Therapy in a Large Quality Consortium of Radiation Oncology Practices. 2017, International Journal of Radiation Oncology Biology Physics 99: 1154-61.
- Sung K, Choi YE, Lee KC (2017) Cardiac risk index as a simple geometric indicator to select patients for the heart-sparing radiotherapy of left-sided breast cancer. J Med Imaging Radiat Oncol 61: 410-7.
- Tanna N, McLauchlan R, Karis S, Welgemoed C, Gujral DM, Cleator SJ (2017) Assessment of Upfront Selection Criteria to Prioritise Patients for Breath-hold Left-sided Breast Radiotherapy Clinical Oncology 29: 356-61.
- Mendez LC, Louie AV, Moreno C (2018) Evaluation of a new predictor of heart and left anterior descending artery dose in patients treated with adjuvant radiotherapy to the left breast Open Access Radiation Oncology 13: 124
- Ueda Y, Gerber NK, Das IJ (2018) Model-based cardiac dose estimation in radiation treatment of left breast cancer. British J Radiology 91: 20180287.
- Tomatis S, Carrara M, Massafra E (2011) Geometry of volumes in radiotherapy planning. A new method for a quantitative assessment. Tumori 97: 503-9.
- De Rose F, Fogliata A, Franceschini D (2016) Phase II trial of hypofractionated VMAT-based treatment for earlystage breast cancer: 2-year toxicity and clinical results. Radiation Oncology. 11: 120.
- Radiation Therapy Oncology Group. Breast Cancer Atlas for Radiation Therapy Planning: Consensus Definitions.
- Tukey, J. W. 1977. Exploratory Data Analysis. Reading, MA: Addison–Wesley.
Artcle Information
Review Article
Received Date: January 04, 2025
Accepted Date: January 23, 2025
Published Date: January 30, 2025
Journal of Artificial Intelligence Systems and Applications
Volume 1 | Issue 1
Citation
Stefano Tomatis (2025) Predictive Model of The Dose to The Heart Based on Geometry Evaluation in Left Breast Radiotherapy. J Artif Intell Syst Appl 1: 101
Copyright
©2025 Stefano Tomatis. This is an open-access article distributed under the terms of the Creative Commons Attribution License, which permits unrestricted use, distribution, and reproduction in any medium, provided the original author and source are credited.

doi: jais.2025.1.101