

Review Article
Volume-1 Issue-1, 2025
Optimal Sizing and Locations of Capacitors in a Radial Distribution System
-
Received Date: March 03, 2025
-
Accepted Date: March 21, 2025
-
Published Date: March 28, 2025
Journal Information
Abstract
A new and powerful approach called Slime Mould Algorithm (SMA) is suggested in this paper, for optimal siting and sizing of capacitors for an IEEE distribution network. First, the most nominee buses for installing capacitors are developed using various indices. Loss Sensitivity Factors (LSF), Voltage Stability Index (VSI), and Power Loss Index (PLI) are employed to determine the elected buses. Then the proposed SMA is used to deduce the size of capacitors and their positions from the picked buses. The objective function is introduced to minimize the net cost and then, increase the total saving per year. The developed approach is tested on the IEEE distribution network. The obtained results are compared with others to highlight the advantages of the developed approach. Also, the results are presented to confirm its influence in minifying the losses, and net cost and to improve the voltage profile and total saving for a radial distribution network.
Key words
Slime Mould Algorithm; Loss Sensitivity Factors; Voltage Stability Index; Power Loss Index; Optimal Capacitor Locations; Distribution System
|
Items |
Un-compensated |
Compensated |
||
|
PLI |
LSF |
VSI |
||
|
Total losses (Kw) |
60.5844 |
40.2634 |
43.8035 |
47.365 |
|
Loss reduction (%) |
- |
33.54 |
27.698 |
21.819 |
|
Minimum voltage |
0.9459 |
0.9619 |
0.9550 |
0.9601 |
|
Optimal location |
- |
700 |
750 |
400 |
|
Total Kvar |
- |
700 |
750 |
400 |
|
Annual cost($/year) |
32563.4 |
25282.44 |
27393.12 |
27515.04 |
|
Net saving ($/year) |
- |
7280.96 |
5170.28 |
5048.36 |
|
% saving |
- |
22.36 |
15.877 |
15.5 |
|
Items |
Un-compensated |
Compensated |
||
|
PLI |
LSF |
VSI |
||
|
Total losses (Kw) |
60.5844 |
34.9447 |
35.1231 |
42.5608 |
|
Loss reduction (%) |
- |
42.32 |
42.026 |
29.75 |
|
Minimum voltage |
0.9459 |
0.9697 |
0.9615 |
0.9623 |
|
Optimal location and size in Kvar |
- |
450@ Bus15 |
450@ Bus 3 |
250@ Bus 13 |
|
Total Kvar |
- |
850 |
850 |
500 |
|
Annual cost($/year) |
32563.4 |
23856.93 |
23950.7 |
26109.96 |
|
Net saving ($/year) |
- |
8706.47 |
8612.7 |
6453.44 |
|
% saving |
- |
26.74 |
26.45 |
19.82 |
|
Items |
Un-compensated |
Compensated |
|||||||||||
|
FGA[14] |
[33] |
PSO[13] |
DE [15] |
[34] |
SMA |
||||||||
|
Total losses (KW) |
61.9547 |
30.4411 |
32.6 |
32.7 |
32.3 |
33.2 |
32.2499 |
||||||
|
Loss reduction (%) |
- |
50.86 |
47.38 |
47.22 |
47.86 |
46.41 |
46.768 |
||||||
|
Lower voltage |
0.9424 |
0.9677 |
- |
- |
- |
- |
0.9679 |
||||||
|
Optimum siting and size in KVAR |
- |
4 |
200 |
3 |
805 |
6 |
871 |
3 |
454 |
3 |
150 |
6 |
250 |
|
6 |
100 |
6 |
388 |
11 |
321 |
6 |
500 |
4 |
300 |
11 |
300 |
||
|
7 |
300 |
|
|
|
|
11 |
178 |
6 |
300 |
15 |
300 |
||
|
11 |
300 |
|
|
|
|
|
11 |
150 |
|
||||
|
15 |
200 |
|
|
|
|
|
|
|
|||||
|
Total KVAR |
- |
1100 |
1193 |
1192 |
1132 |
900 |
850 |
||||||
|
Annual cost($/year) |
32563.4 |
24599.8 |
24339.6 |
24387.1 |
24496.8 |
24429.9 |
23060.54 |
||||||
|
Net saving ($/year) |
- |
7963.6 |
8223.8 |
8176.3 |
8066.4 |
8133.5 |
9502.86 |
||||||
|
% saving |
- |
24.46 |
25.26 |
25.11 |
24.77 |
24.98 |
29.183 |
||||||
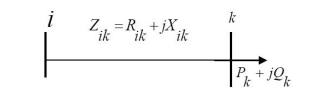 |
| Figure 1: Radial distribution network equivalent circuit |
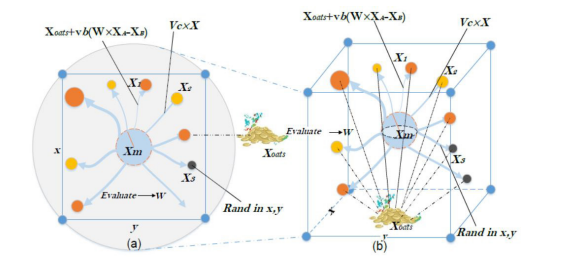 |
| Figure 2:Potential location in 2_dimensional and 3_dimensional |
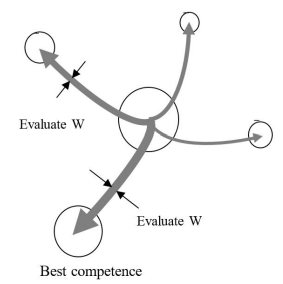 |
| Figure 3: Evaluation of the competence function |
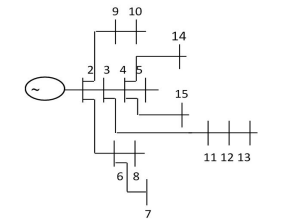 |
| Figure 4: The connection diagram of the 15-point system |
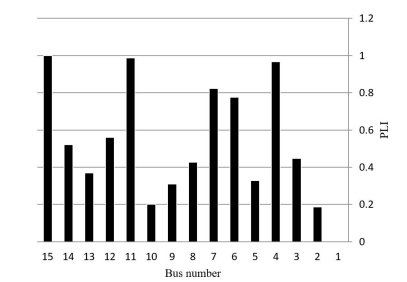 |
| Figure 5: PLI for the 15 system |
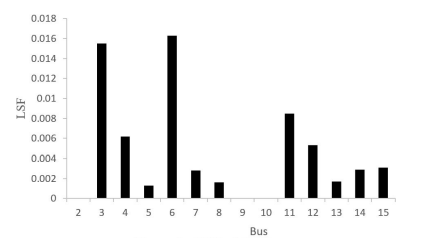 |
| Figure 6: LSF of the first system |
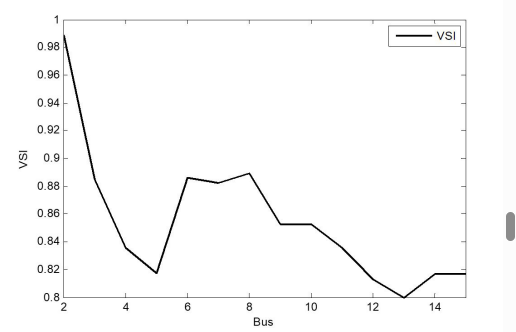 |
| Figure 7: VSI for the 15 system |
 |
| Figure 8: Effect of installing one capacitor on system voltage |
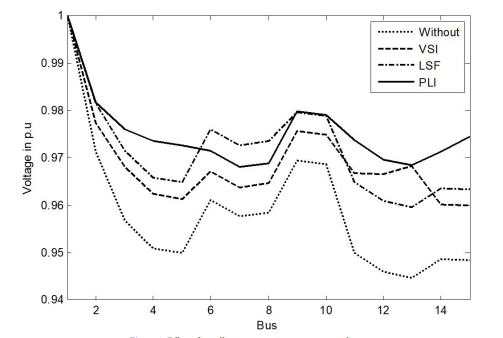 |
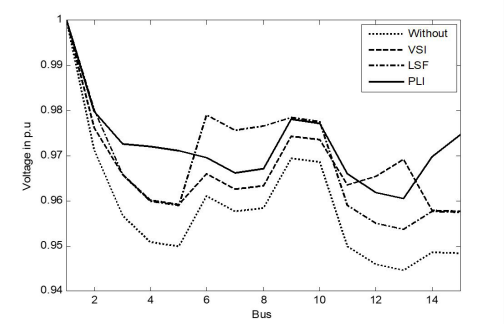
| Figure 9: Effect of installing two capacitors on system voltage |
Introduction
Transmission and distribution system losses are considered the main consumption in any power network. Due to the growth in the load, and environmental limits, the transmission, and distribution networks are being worked under overloaded situations, and losses in the distribution systems have become the main concern. To attain economic advantages, the fundamental conditions to get agreeable power quality and enhanced efficiency have formed a very auspicious environment for the matter of loss minimization approaches and using recent operational practices. Power loss reduction is the only alternative to enhance the efficacy of the distribution network. Therefore, it is noted that in the last few decades many researchers have concentrated on distribution network loss reduction and voltage stability. There are many helpful techniques in the literature for distribution network loss reduction [1]. However, the most often used mechanisms like (a) capacitor siting, (b) network restructure [2] (c) DG siting [3], (d) DSTATCOM siting and its mixed versions to realize upper potential interests are (e) simultaneous restructure and capacitor siting, (f) simultaneous restructure and DG siting, (g) simultaneous DG and DSTATCOM siting, and (h) simultaneous restructure, capacitor, and DG siting are presented in [1]. Conventionally, loss reduction has focused mainly on network restructure optimizing or capacitor siting for reactive power policy. Since installing capacitors are the simplest and most famous solution, they are getting steadily to be important components of the distribution network [1].
Pending last years, diverse algorithms are presented to find the proper locations and optimal sizes of shunt capacitors. Simulated Annealing (SA) [4], Tabu Search (TS) [5], Genetic Algorithm (GA) [6], Mixed Integer Nonlinear Programming Approach (MINPA) [7], Direct Search Algorithm (DSA) [8], Teaching Learning Based Optimization (TLBO) [9], Plant Growth Simulation Algorithm (PGSA) [10], Heuristic Algorithm [11], Cuckoo Search Algorithm (CSA) [12], Particle Swarm Optimization (PSO) [13], Fuzzy Genetic Algorithm (FGA) [14], Differential Evolution (DE) [15], Flower Pollination Algorithm (FPA) [16-17], Improved Harmony Search (IHS) [18], Mine Blast Algorithm (MBA) [19], and Moth Swarm Algorithm (MSA) [20] are developed to deal with the capacitor placement task. However, these techniques may drop to compass the optimum cost. To conquer these abuses, the SMA is chosen in this article to treat the process of optimum capacitor placement.
SMA is a vigorous population-based optimizer based on the oscillation mode of slime mould in nature [21-23]. It proves its effectiveness in many applications [24-25]. It is suggested here as a modern optimization approach to minify the net active power losses, the net cost and to promote the voltage profiles for an IEEE distribution network. The stations of the shunt capacitors procedure are acquired firstly by inspecting the points according to many indices. Then SMA is submitted to deduct the optimum siting and sizing of capacitors from specific nodes. The validation of the suggested algorithm in progressing the voltage profile and lowering resistive losses is given for an IEEE distribution system. The results of the SMA are compared with several algorithms to assert its superiority
The rest of the paper is constituted as follows: Section 2 shows the different indices for capacitor installing techniques. Section 3 presents the cost function and limits. Section 4 introduces Slime Mould Algorithm. Section 5 examines the results on voltage profiles and power loss. Section 6 gives the conclusion and future works to treat the distribution network optimization process.
Various IndicesIn this section, three different indices with their equations are introduced.
Power Loss IndexIn this article, PLI is utilized to specify the nominee points for capacitors. The region of inspection is diminished greatly and then wasted time in the optimization procedure. The demerit of this index is the pivotal computations.It is desired to execute load flow and define the attenuation in power losses by intromission reactive power at every bus except the slack one [26-27]. The PLI is given as the following equation.
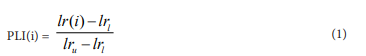
Where
lru: The upper attenuation in actual power losses.
lrl: The lower attenuation in actual power losses.
lri: The attenuation in actual power losses at the bus i.
The buses of greater PLI will have the primacy to be the nominee bus to constitute compensator apparatus.
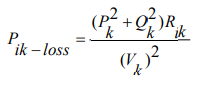
Loss Sensitivity FactorsLSFs are appointed to specify the nominee buses to install capacitors [28]. Figure 1, shows a transmission line 'l ' linked between 'i ' and ' k ' buses.
The actual power loss is obtained by  in this line that can
be computed by
in this line that can
be computed by
The LSFs can be given from the following equation:
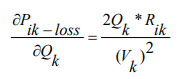
The typical voltages are specified by dividing the base voltages by 0.95. If these voltages are lower than 1.01 they can be suggested as nominee nodes for capacitor installation. It is account note that the LSFs judge the series in which nodes are to be prepared to install capacitors.
Voltage Stability IndexVSI amount is close to 1 so the least VSI amounts, the mightily sensitive points to voltage collapse. Thus, VSI is utilized to elect the lowest points that have more probability of voltage collapse along all points. VSI amount is designated as the following equation [29-31]
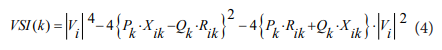
where
Vi: The magnitude of the voltage at the bus i.
Cost FunctionThe developed cost function of the optimum capacitor position task is to lessen the net cost which is planned as the following equation:
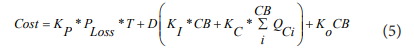
Where the parameters are given as [17].
Kp: The price per KW-Hours equalizes to 0.06 $/KW-Hours,
PLoss: The net losses after compensation,
T : The time in Hours equalizes to 8760,
D : The depreciation agent equalizes to 0.2,
CB : The number of compensated points,
KC: The price per Kvar equalizes to 25 $/Kvar,
KI: The price per inauguration equalizes to 1600$,
QC: The value of inaugurated reactive power in Kvar,
KO: The working price equalizes to 300 $/year/position.
The overhead equation is constricted whereas accepting the following equality and inequality limits.
Equality Limits
Load flow limitConventional methods cannot be utilized in distribution networks due to ill conditions. The forward sweep method has been presented in [29] to treat the load flow process of distribution networks. The equality limit is shown by the following equation:
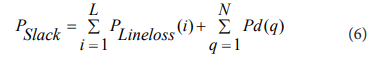
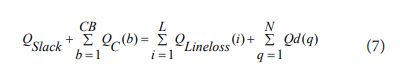
Where
PSlack: The active power of the slack node,
QSlack: The reactive power of the slack node,
L : The size of the transmission line in a distribution network,
Pd(q): The request for active power at bus q,
Qd(q): The request for reactive power at bus q,
N: The size of total nodes.
Inequality Limits
Voltage LimitsThe magnitude of the voltage at every node must be constrained by the following limit:
0.90 ≤ V ≤ 1.05
Compensation LimitThe injected reactive power at every nominee node should be lower than its efficient reactive power.
Power Factor ConstraintPower Factor (PF) should override the lower amount and less than the upper amount as given by the following limit.
Remarkably, the net injected reactive power is lower than 0.7 of the net reactive power request to extend the operating of the power system with lagging PF and prohibition the leading one.
Physarum polycephalum has been named slime mould because it is considered a fungus [21].
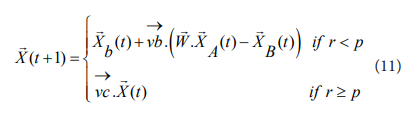
Approach foodSMA is illustrated by the mathematical equations of [21-22]. The equations represent the contraction mechanism as follows:
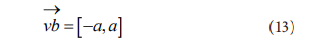
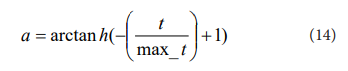
Where  is a value [− a, a],
 is reduced linearly from 1 to 0,
t is the tth iteration,
 is the individual location with the
most concentrated scent?
is the individual location with the
most concentrated scent?
 is the location of slime mould
(solution)?
is the location of slime mould
(solution)?
 and
and  are the random selection of two
individuals from
the population,
are the random selection of two
individuals from
the population,
 is the weight solution,
p is computed as:
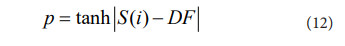
∈ 1,2,3,...,n,S(i) is to the competence of 
DF is the most competence calculated over all iterations?
 is computed as follows:
 is computed as follows:
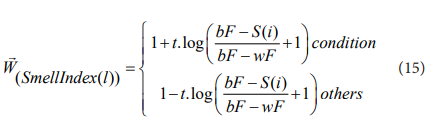

S(i) ranks the first half of the given solutions,
r a random number [0,1],
bF is the optimal competence existing in the current iteration?
wF is the worst competence existing in the current iteration?
smellIndex is the sequence of the sorted competence values?
Figure 2: shows the impacts of (11).
Wrap foodWhen the search area extends to an area with a rather low concentration of food, its importance will decrease and the food group will go to explore other areas. Fig. 3 shows the competence evaluation functions for slime mould [23-24].
The solution location is updated according to the following equation:
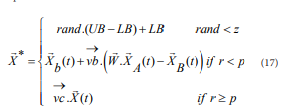
Where, LB is the lower limit of the search space,
UB is the upper limit of the search space?
r is a random value [0, 1].
Grabble food
 is a random vector between [− a,a]
and regularly accessed zero
as the repetitions advance. The
is a random vector between [− a,a]
and regularly accessed zero
as the repetitions advance. The  values lay between [−1,1] and
are driven to zero in the end. Synergistic cooperation between and
imitate the specific manner of slime mould. Although
sticky mould is a better source of nutrition, it is preferable to
distribute the organic matter to explore other areas to find the
best food source rather than pouring it all into one source to
find a more reliable source of food. The Pseudo-code of the SMA
algorithm is shown below [25].
values lay between [−1,1] and
are driven to zero in the end. Synergistic cooperation between and
imitate the specific manner of slime mould. Although
sticky mould is a better source of nutrition, it is preferable to
distribute the organic matter to explore other areas to find the
best food source rather than pouring it all into one source to
find a more reliable source of food. The Pseudo-code of the SMA
algorithm is shown below [25].
Initialize population_size , dim, LB, UB, z , Max _ iter ;
Initialize a set of Slime Mould random locations X (i 1,2, ,n) i = 1;
While (t ≤ Max _ iter )Compute and sort the competence of all Slime Mould;
Update the best and the worst competence
Calculate the weight of Slime Mould 
Update the best competence, the best location 
For each search agent
Update p ,
Update the position of search agent
End Fort = t +1
End WhileReturn the best competence, best location
Results and Discussion
The prevalence of the suggested SMA is applied to an IEEE distribution system. The results of 15 radial distribution systems are offered below in detail. The suggested algorithm has been completed via Matlab [32]. Simulations were performed under the Matlab environmental (release 2013 a) and done on a Lenovo laptop with Intel core i7 CPU 2.90 GHz processor with 4 GB RAM and a 64-bit operating system.
15 Bus Test SystemThe tested case is 15 bus system as given in Figure (4). The system data are displayed in [31]. The total load for this system is 1752 KVA with PF=0.7. The losses without compensation are 60.5844 KW. Figure (5) gives the nominee buses according to their PLI. The ordered of these buses are 15, 11, 4, 7, 6, 12, 14, 3, 8, 13, 2. The nominee buses are obtained in Figure (6) according to LSF. The ordered of buses are 6, 3, 11, 4, 12, Figure (7) shows the nominee buses according to VSI values. The improvements in system voltages due to install one and two capacitors are shown in Figures (8, 9) respectively. A comparison between various indices is performed and shown in Table (1, 2) for installing one and two capacitors respectively. It is clear that, PLI gives better results than VSI and LSF for this system. Based on these results, SMA is proposed with PLI to give the better response in terms of cost and losses. The notability of the suggested SMA is demonstrated compared with other algorithms in [13,14,15,33,34]. The value of installed capacity of reactive power is 850 KVAR. The minimum voltage is increased from 0.9424 to 0.9679 p.u. The losses with compensation are decreased to 32.2499 KW due to capacitors installation as given in Table (3). The percentage reduction in losses is increased to be 46.768%. Moreover, the value of total cost due to the proposed objective algorithm is 23060.54 $ which is the smallest one. Also, the net saving with the proposed SMA is improved to 29.183 % which is the maximum one compared with other algorithms.
Conclusion
In this paper, SMA has been applied successfully to solve the tasks of optimum positions and sizing of capacitors in distribution system that have been established as an objective optimization task with competing power losses, cost of installation, operation and injected vars. The superiority of the suggested approach is clarified by using IEEE test system. Also, the results have been compared with those obtained using recent optimization techniques. Moreover, it provides a preferable performance over others in terms of voltage profiles, active power losses, net cost, and total saving. Application of the network reconfiguration and distributed generation with the most novel optimization algorithm to reduce the active losses is the future scope of this work.
References
- KS Sambaiah, T Jayabarathi (2020) “Loss Minimization Techniques for Optimal Operation and Planning of Distribution Systems: A Review of Different Methodologies”, Int. Transactions on Electrical Energy Systems 30: e12230.
- SM Abd-Elazim, ES Ali (2021) “Optimal Network Restructure via Improved Whale Optimization Approach”, Int. Journal of Communication Systems 34: e4617.
- A Awad, H Abdel-Mawgoud, S Kamel, AA Ibrahim, F Jurado (2021) “Developing a Hybrid Optimization Algorithm for Optimal Allocation of Renewable DGs in Distribution Network”, Clean Technol 3: 409-23.
- H Chiang, J Wang, O Cockings, H Shin (1990) “Optimal Capacitor Placements in Distribution Systems: Part 1: A New Formulation and the Overall Problem”, IEEE Trans. Power Del 5: 634-42.
- R Gallego, A Monticelli, R Romero (2001) “Optimal Capacitor Placement In Radial Distribution Networks using Tabu Search”, IEEE Trans. Power Syst 16: 630-7.
- M Sydulu, V Reddy (2007) “Index and GA based Optimal Location and Sizing of Distribution System Capacitors”, IEEE Power Engineering Society General Meeting 1-4, Tampa, FL 24-8.
- S Nojavan, M Jalali, K Zare (2014) “Optimal Allocation of Capacitors in Radial/Mesh Distribution Systems Using Mixed Integer Nonlinear Programming Approach”, Electr. Power Syst. Res 107: 119-24.
- M Raju, K Murthy, K Avindra (2012) “Direct Search Algorithm for Capacitive Compensation in Radial Distribution Systems”, Int. J. Electr. Power Energy Syst 42: 24-30
- S Sultana, P Roy (2014) “Optimal Capacitor Placement in Radial Distribution Systems Using Teaching Learning based Optimization”, Int. J. Electr. Power Energy Syst 54: 387-98.
- A Sarma (2011) “Optimal Selection of Capacitors for Radial Distribution Systems Using Plant Growth Simulation Algorithm”, Int. J. Adv. Sci. Technol 30: 43-54.
- A Hamouda, S Sayah (2013) “Optimal Capacitors Sizing in Distribution Feeders Using Heuristic Search based Node Stability Indices”, Int. J. Electr. Power Energy Syst 46: 56-64.
- P Das, S Banerjee (2013) “Placement of Capacitor in A Radial Distribution System Using Loss Sensitivity Factor and Cuckoo Search Algorithm”, Int. J. Sci. Res. Manag 2: 751-7.
- K Prakash, M Sydulu (2007) “Particle Swarm Optimization based Capacitor Placement on Radial Distribution Systems”, IEEE Power Engineering Society General Meeting 24-8.
- PV Prasad, S Sivanagaraju, N Sreenivasulu (2007) “A Fuzzy Genetic Algorithm for Optimal Capacitor Placement in Radial Distribution Systems”, ARPN J Eng Appl Sci 2: 28-32.
- K Prakash, M Sydulu (2012) “Optimal Capacitor Placement in Radial Distribution Systems Using Differential Evolution”, J. Electr Eng 12: 144-9.
- AY Abd-Elaziz, ES Ali, SM Abd-Elazim (2016) “Flower Pollination Algorithm for Optimal Capacitor Placement and Sizing in Distribution Systems”, Electric Power Components and System 44: 544-55.
- A Abd-Elaziz, ES Ali, SM Abd-Elazim (2016) “Flower Pollination Algorithm and Loss Sensitivity Factors for Optimal Sizing and Placement of Capacitors in Radial Distribution Systems”, Int. J. of Electrical Power and Energy Systems 78: 207-14.
- ES Ali, SM Abd-Elazim, A Abd-Elaziz (2016) “Improved Harmony Algorithm and Power Loss Index for Optimal Locations and Sizing of Capacitors in Radial Distribution Systems”, Int. J. of Electrical Power and Energy Systems 80: 252-63.
- ES Ali, SM Abd-Elazim (2018) “Optimal Locations and Sizing of Capacitors in Radial Distribution Systems Using Mine Blast Algorithm”, Electrical Engineering, Springer 100: 1-9.
- TL Duong, TT Nguyen, VD Phan, Thang Trung Nguyen (2020) “Determining Optimal Location and Size of Capacitors in Radial Distribution Networks Using Moth Swarm Algorithm”, Int. J. of Electrical and Computer Engineering (IJECE) 10: 4514-21.
- S Li, H Chen, M Wang, AA Heidari, S Mirjalili (2020) “Slime Mould Algorithm: A New Method for Stochastic Optimization”, Future Generation Computer Systems 111: 300-23.
- RE Precup, RC David, RC Roman, EM Petriu, AIS Stinean (2021) “Slime Mould Algorithm Based Tuning of CostEffective Fuzzy Controllers for Servo Systems”, Int. Journal of Computational Intelligence Systems 14: 1042-52.
- ZM Gao, J Zhao, Y Yang, XJ Tian (2020) “The Hybrid Grey Wolf Optimization Slime Mould Algorithm”, 2nd International Conference on Electronic Engineering and Informatics 1617: 012034.
- K Yu, L Liu, Z Chen (2021) “An Improved Slime Mould Algorithm for Demand Estimation of Urban Water Resources”, Mathematics 9: 1316.
- AMA El Hameda, M Ebeedb, A Refaib, MA El Sattarc, AA Elbasetd et al. (2021) “Application of Slime Mould Algorithm for Optimal Allocation of DSATACOM and PV System in Real Egyptian Radial Network”, Sohag Engineering Journal (SEJ) 1: 16-24.
- SM Kannan, P Renuga, ARG Monica (2010) “Optimal Capacitor Placement and Sizing Using Combined Fuzzy-HPSO Method”, Int. J. of Engineering, Science and Technology 2: 75-84.
- VU Reddy, A Manoj (2012) “Optimal Capacitor Placement for Loss Reduction in Distribution Systems Using Bat Algorithm”, IOSR J. of Engineering 2: 23-7.
- S Jalilzadeh, M Sabouri, E Sharifi (2012) “Optimal Capacitor Placement in a Radial Distribution System Using Shuffled Frog Leaping and Particle Swarm Optimization Algorithms”, Int. J. on Network Security 3: 16-20.
- D Das, DP Kothari, A Kalam (1995) “Simple and Efficient Method for Load Flow Solution of Radial Distribution Networks”, Int. J. of Electrical Power and Energy Systems 17: 335-46.
- M Chakravorty, D Das (2001) “Voltage Stability Analysis of Radial Distribution Networks”, Int. J. of Electrical Power and Energy Systems 23: 129-35.
- J Garg, P Swami (2014) “Calculating Voltage Instability Using Index Analysis In Radial Distribution System”, Int. J. of Modern Engineering Research 4: 15-26.
- MathWorks, available at: http:// www.mathworks.com.
- MH Haque (1999) “Capacitor Placement in Radial Distribution Systems for Loss Reduction”, IEE Proceed Gener, Trans Distrib 146: 501-5.
- HM Khodr, A Zita, C Vale Ramos (2009) “Optimal Cost Benefit for the Location of Capacitors in Radial Distribution Systems”, IEEE Trans Power Deliv 24: 787-96.
Artcle Information
Review Article
Received Date: March 03, 2025
Accepted Date: March 21, 2025
Published Date: March 28, 2025
Journal of Artificial Intelligence Systems and Applications
Volume 1 | Issue 1
Citation
Stefano Tomatis (2025) Predictive Model of The Dose to The Heart Based on Geometry Evaluation in Left Breast Radiotherapy. J Artif Intell Syst Appl 1: 102
Copyright
©2025 Stefano Tomatis. This is an open-access article distributed under the terms of the Creative Commons Attribution License, which permits unrestricted use, distribution, and reproduction in any medium, provided the original author and source are credited.

doi: jais.2025.1.102