

Research Article
Volume-2 Issue-1, 2024
Top 25 Companies with Biotech Therapeutics – Biotech Companies Remain Mainstay for New Product Success along with Pharma Collaboration
-
Received Date: October 20, 2024
-
Accepted Date: November 20, 2024
-
Published Date: November 23, 2024
Journal Information
Switch to Full Text Menu
Abstract
This manuscript addresses the top 25 companies committed to biotechnology therapeutics that change over time covering their history over past 25 years through 2023. Furthermore, key issues include their productivity in product numbers, sales of products and companies, the types of molecules, the impact of in-licensing and out-licensing versus internal product development, engagement by new versus established companies, impact of major mergers and acquisitions, FDA approval history especially for novel products [biotech versus drugs], research funding and partnership funding by pharma for biotech, and the top biotech products by these companies as well. Numerous tables provide the extensive data supporting these company and biotechnology issues. These top 25 companies committed to biotechnology therapeutics have marketed over 50% of all biotech products, out of the 275 companies with biotech products, especially the leaders throughout the 25 years – Roche, Amgen, Novo Nordisk, Biogen, Eli Lilly, Johnson & Johnsson, Novartis, and Sanofi. The whole biopharma industry across the world is now heavily committed to biotechnology products. These companies have acquired the majority of their biotech products [versus internal development], especially through mergers and acquisitions.
Key words
Biotech Therapeutics, Biotech, Pharma Collaboration, Drugs, Biotechnology, Biotech Products
Abbreviations
Companies: AbbV - AbbVie, Abt - Abbott, Alex - Alexion, Allrgn - Allergan, Amg - Amgen, AstraZen - AstraZeneca, Bgn - Biogen, BMS - Bristol Myers Squibb, C or Co. or Comp. - Companies, Eis - Eisai, Genent. - Genentech, Genet. In. - Genetics Institute, GlaxoSK. - GlaxoSmithKline, Imx - Immunex, Jhn & Jhn - Johnson & Johnson, Kir. - Kirin, Merck KG - Merck KGaA, Mit - Mitsubishi, Mrk - Merck, Novo N - Novo Nordisk, Pharma.Upj. - Pharmacia-Upjohn, Pl. - Plough, Pzr - Pfizer, Regen - Regeneron, Sch. AG - Schering AG, Sq - Squibb, Tak - Takeda, TMC - The Medicines Company, Wye - Wyeth,
Products and Diseases: B - Biotech or Biosimilar, Bb - Blockbuster, Cho - Carbohydrate, Cllgn - Collagen, CT - Cell therapy, D - Drug or Dermatology disorders, E - Endocrine disorders, GE - Gastroenterology disorders, GT - Gene Therapy, Gyn - Gynecology disorders, H - Hematology disorders, Hyal - Hyaluronidase, ID - Infectious Dis
| Co. [$B] in 2000 | Co. [$B] 2005 | Co. [$B] 2010 | Co. [$B] 2015 | Co. [$B] 2020 | Co. [$] 2023 | |
| 1 | Roche 3.82 | Amgen 11.81 | Roche 23.93 | Roche 30.26 | Roche 40.44 | Roche 42.04 |
| 2 | Jhn. & Jhn. 3.50es | Roche 11.15 | Amgen 14.85 | Amgen 19.53 | AbbVie 22.84 | Merck 36.23 |
| 3 | Amgen 3.20 | Genent. 7.98 | Novo N. 9.59 | AbbVie 15.58 | Amgen 21.57 | Novo N. 33.33 |
| 4 | Novo N. 2.34 | Jhn. & Jhn 5.85 | Pfizer 9.28 | Novo N. 15.26 | Merck 21.25 | AbbVie 30.55 |
| 5 | Eli Lilly 2.33 | Novo N. 4.79 | Merck 8.64 | Sanofi 13.62 | Jhn & Jhn 19.79 | Takeda 29.90 |
| 6 | Novartis 1.8 es | Wyeth 3.79 | Sanofi 8.03 | Pfizer 12.74 | Novo N. 19.29 | Jhn & Jhn. 29.16 |
| 7 | Wyeth 1.64 | Eli Lilly 3.51 | Abbott 7.80 | Jhn & Jhn 11.13 | Eli Lilly 16.59 | Sanofi 24.86 |
| 8 | Schering Pl. 1.59 | Scher. Pl. 3.51 | Jhn & Jhn 7.48 | Merck 7.93 | Sanofi 15.99 | Amgen 24.20 |
| 9 | Genentech 1.28 | Sanofi 2.79 | Eli Lilly 6.05 | Novartis 7.91 | Novartis 14.13 | Pfizer 23.80 |
| 10 | GlaxoSK. 1.01 | Abbott 2.40 | Merck KG 4.59 | Eli Lilly 7.54 | Takeda 14.05 | Eli Lilly 22.87 |
| 11 | Serono .864 | Scher. AG 2.27 | Novartis 4.39 | Biogen 7.35 | BMS 13.73 | BMS 18.62 |
| 12 | Biogen .761 | Biogen 2.25 | Genzyme 4.11 | Baxalta 6.15 | Pfizer 10.94 | AstraZen. 17.29 |
| 13 | AstraZeneca .761 | Serono 2.16 | Teva 3.52 | BMS 6.10 | Biogen 9.92 | Novartis 17.08 |
| 14 | Immunex .760 | Novartis 1.85 | Biogen 3.15 | Merck KG. 4.30 | Regener. 8.80 | GSK 14.92 |
| 15 | Genzyme .537 | Genzyme 1.68 | Bayer 2.98 | Teva 4.02 | GlaxoSK 7.73 | Regener. 13.12 |
| 16 | Bayer .524 | Baxter 1.53 | GlaxoSK. 2.57 | Baxter 2.84 | Alexion 6.71 | Biogen 7.18 |
| 17 | Baxter .50 es | Teva 1.50e | AstraZen. 2.15 | Regener. 2.71 | AstraZen. 4.58 | Moderna 6.67 |
| 18 | Chiron .468 | GlaxoSK. 1.32 | Baxter 1.70 | Pfizer 2.68 | Bayer 4.41 | Merck KG. 4.79 |
| 19 | MedImmune.427 | AstraZen. 1.00 | BMS 1.50 | GlaxoSK. 2.61 | Astellas 3.55 | Bayer 4.55 |
| 20 | Pharma.Upj. .490 | Bayer .830 | Allergan 1.42 | Alexion 2.60 | Merck KG. 3.81 | BioNTech 4.13 |
| 21 | Schering AG.28es | Allergan .830 | Takeda 1.21 | Allergan 2.58 | Ipsen 2.41 | UCB 3.44 |
| 22 | Allergan .249 | Pfizer .810 | Shire .798 | Shire 2.57 | Teva 2.02 | Gilead 3.42 |
| 23 | Teva .247 | Organon .440 | Ipsen .662 | AstraZen. 2.38 | SOBI 1.56 | Astellas 3.11 |
| 24 | Millenium .197 | Genet. In. .343 | Kyowa Kir. .614 | Bayer 2.25 | Kyowa Kir. 1.52 | Ipsen 2.66 |
| 25 | Merck .134 | TMC .141 | Alexion .541 | Takeda 2.05 | BioMarin 1.35 | Daiichi Sa. 2.64 |
| # Pr. | 53 prod. Reports | 76 products | 121 products | 157 products | 239 products | 267 products |
| T. $Inc | $29.9 B USD 337% In vs 1995 | $76.5 B USD 158% In vs ‘00 | $131.5 B USD73.5% In vs ‘05 | $195.5 B USD 48.7% In vs ‘10 | $289.0 USD 47.8% In vs ‘15 | $420.6 B USD 45.5% In vs ‘20 |
| All C ProdT. $ | Comp.73 prod.$30.7 B USD | 76 Comp.163 prod.$78.2 B USD | 83 Comp.194 prod.$134.3 B USD | 90 Comp.286 prod.$199.1 B USD | 164 Comp.466 prod.$326.7 B USD | 194 Comp.680 prod,$470.2 B USD |
| Company | WW Sales | Time Yrs | # Prod. in ’23 & Rank | Company | WW Sales | Time Yrs | # Prod. in ’23 & Rank | ||
| 1 | Roche EU B | 582.6 | 25 | 32 #3 | 16 | Merck KGaA EU | 74.7 | 17 | 9 #17 |
| 2 | Amgen B | 372.3 | 26 | 30 #4 | 17 | Regeneron B | 70.2 | 16 | 8 #18 |
| 3 | Novo Nordisk EU B | 300.5 | 26 | 25 #6 | 18 | Bayer EU | 68.7 | 23 | 6 #19 |
| 4 | Johnson & Johnson | 273.5 | 24 | 12 #15 | 19 | Teva Isr | 60.4+ | 25 | 16 #10 |
| 5 | Pfizer | 258.5 | 21 | 40 #2 | 20 | Abbott | 53.5 | 12 | 3 |
| 6 | AbbVie | 237.6 | 12 | 14 #11 | 21 | Genentech* B | 45.7 | 11 | 9 |
| 7 | Sanofi EU | 227.0 | 21 | 42 #1 | 22 | Moderna B | 41.7 | 3 | 1 #23 |
| 8 | Merck | 212.0 | 18 | 13 #13 | 23 | Shire* B | 35.7 | 13 | 13 |
| 9 | Eli Lilly | 202.5 | 26 | 23 #7 | 24 | Wyeth* | 31.9 | 10 | 5 |
| 10 | Novartis EU | 158.7 | 23 | 17 #9 | 25 | Alexion* B | 30.9 | 13 | 4 |
| 11 | Bristol Myers Squibb | 127.9 | 19 | 11 #16 | 26 | Allergan* B | 28.6 | 18 | 3 |
| 12 | Biogen B | 121.0 | 26 | 14 #12 | 27 | Schering Plo.* EU | 28.5 | 11 | 7 |
| 13 | AstraZeneca EU | 95.5 | 25 | 20 #8 | 28 | Baxter | 25.8 | 15 | 4 #22 |
| 14 | GlaxoSmithKline | 94.9 | 26 | 13 #14 | 29 | Ipsen EU | 21.9 | 15 | 5 #20 |
| 15 | Takeda Jp | 87.3 | 20 | 28 #5 | 30 | UCB EU | 21.1 | 16 | 5 #21 |
| Year | FDA Biotech Product Approvals | * Novel Biotech product Approval | % Novel Products in Biotech | All D & B NME/NBE + Novel Products | % Novel biotech Vs all Products | Top 25 Company Sponsors | % Top 25 Company Sponsors | New Company Sponsors | % New Company Sponsors |
| 2023 | 51 | 36 | 70.6 | 70 | 57.1 | 24 | 47.1 | 16 | 31.4 |
| 2022 | 31 | 23 | 74.2 | 41 | 58.5 | 11 | 35.5 | 10 | 32.3 |
| 2021 | 39 | 28 | 71.8 | 57 | 54.4 | 17 | 43.6 | 13 | 33.3 |
| 2020 | 30 | 18 | 60.0 | 53 | 37.7 | 15 | 50.0 | 9 | 30% |
| 2019 | 36 | 16 | 44.4 | 47 | 36.2 | 19 | 52.8 | 6 | 16.7 |
| 2018 | 34 | 24 | 70.6 | 62 | 37.1 | 9 | 26.5 | 6 | 17.6 |
| 2017 | 38 | 22 | 57.9 | 52 | 46.2 | 22 | 57.9 | 8 | 21.1 |
| 2016 | 23 | 15 | 65.2 | 25 | 60.0 | 12 | 52.2 | 4 | 17.4 |
| 2015 | 26 | 21 | 80.8 | 54 | 40.7 | 12 | 46.2 | 5 | 19.2 |
| 2014 | 27 | 20 | 74.1 | 47 | 44.7 | 16 | 59.3 | 3 | 11.1 |
| All | 335 | 223 | 66.6% | 508 | 43.9 | 157 | 46.9% | 80 | 23.8% |
| 1970s | [5 Companies]: Biogen 1978 [12 products], Centocor 1978 [7], Cetus 1971 [2], Elan 1969 [5], Genentech 1976 [24], |
| 1980-1984 | [12 Comp.]: Amgen 1980 [16], Celltech 1980 [4], Chiron 1981 [4], Enzon 1981 [6], Genetics Institute 1980 [5], Genzyme 1981 [13], Immunex 1981 [2], ImmunoGen 1981 [3], Immunomedics 1982 [1], Imclone 1984 [2], Scios 1981 [1], Xoma 1981 [2] |
| 1985-1989 | [22 Comp.]: Amylin 1987 [5], Ares-Serono 1987 [9], Cambridge Antibody Technology 1989 [5], Celgene 1986, Cor Therapeutics 1988 [1], Dyax 1989 [2], Gilead 1987, IDEC 1986 [2], Ionis 1989 [6], Ligand 1987 [2], Liposome Company 1986 [1], Medarex 1987 [4], MedImmune 1988 [7], NPS 1986 [2], Organogenesis 1985 [2], Protein Design Labs 1986 [11], Regeneron 1988 [11], Seattle Genetics 1987 [4], Shire 1986 [11], Tanox 1986 [4], Transkaryotic Therapies 1988 [3], Vertex 1989 |
| 1990-1994 | [7 Comp.] Corixa 1994 [1], Cubist 1992 [1], Geron 1990 [1], Human Genome Sciences 1992 [3], Millenium 1993 [3], Morphosys 1992 [2], Nektar 1990 [12], NeXstar 1991 [3] |
| 1995-1999 | [7 Comp.] Abgenix 1996 [1], Affymax 1998 [1], BioMarin 1997 [7], Cellectis 1999 [0], GenMab 1999 [6], Ionis 1989 [6] The Medicines Company 1996 [1] |
| #1 | Genentech [24] |
| #2 | Amgen [16] |
| #3 | Genzyme [13], Biogen [11], Shire [11] |
| #6 | Regeneron [10] |
| #7 | Serono [9] |
| #8 | BioMarin [7], Centocor [7], MedImmune [7] |
| #11 | Ionis [6], GenMab [6], Genetics Institute [6] |
| #14 | Amylin [5], Cambridge Antibody Technology [5], Medarex [5] |
| #17 | Celltech [4], Chiron [4] |
| #19 [to #21] | 3 Companies [3] |
| #22 [to #31] | 10 Companies [2] |
| #32 [to #41] | 10 Companies [1] |
| Rank Company | A. Acquisitions: % & No. + Tot. No. Products | B. Current Marketed Products & Type of Molecules |
| 1. Sanofi [EU] | 75% Acquired - 32 Acquired of 42 products from 12 Companies | 38 ww/4 EU; Hyal -1, Mab - 11, Pep - 9, Prot - 15, Vac - 6 |
| 2. Pfizer | 78% - 32 of 40 from 15 Co.; 2 d/c | 35 ww/3 EU; Cho - 1, Mab - 16, Pep - 5, Prot - 12, Vac - 6 |
| 3. Roche | 72% - 26 of 36 from 12 Co.; 5 d/c | 26 ww/5 EU; GT - 1, Mab - 22, Pep - 1, Prot - 7 |
| 4. Amgen | 42.4% - 14 of 33 from 13 Co.; 5 Out-lic.; 1 d/c | 27 ww; Mab - 16, Pep - 2, Prot - 8, Vac - 1 |
| 5. Takeda | 100% - 29 of 29 fr. 16 Co.; 2 d/c | 21/5 EU/1 Jp; CT - 2, Cgn - 1, Mab - 4, Pep - 5, Prot - 15 |
| 6. Novo Nordisk [EU] | 8.0% - 2 of 25 from 2 Co. | 25 ww; Oligo - 1, Pep - 17, Prot - 7 |
| 7. Eli Lilly | 34.8% - 8 of 22 from 4 Co. | 22 ww; Mab - 7, Pep - 14, Prot – 1 |
| 8. Sandoz [EU] | 4.8% - 1 of 21 from 1 comp. | 21 ww; Mab - 5, Pep - 10, Prot – 6, Biosimilars -14 |
| 9. Biogen | 85.7% - 18 of 21; 1 Out-lic.; 5 d/c | 12 ww/3 EU; Mab - 10, Oligo - 2, Prot - 3 |
| 10. AstraZeneca [EU] | 100% - 20 of 20 from 12 Co.; 3 d/c | 17 ww; Mab - 10, Oligo - 1, Pep - 5, Prot - 1 |
| 11. Merck | 68.4% - 13 of 19 from 11 Co.; 1 Out-lic.; 5 d/c | 13 ww; Mab - 4, Pep - 1, Prot - 1, Vac - 7 |
| 12. Novartis | 94.4% - 17 of 18 from 26 co.; 1 Out-lic.; 2 d/c | 15 ww; CT - 1, GT - 2, Oligo - 1, Mab - 10, Pep - 1 |
| 13. Johnson & Johnson | 94.4% - 17 of 18 from 11 Co.; 1 Out-lic.; 1 d/c | 13 ww/2 EU; CT - 1, Lipo – 2, Mab - 9, Prot - 3 |
| 14. Teva [Isr] | 57.9% - 9 of 16 from 10 Co.; 1 Out-lic.; 1 d/c | 11 ww/3 EU; Mab - 5, Pep - 5, Prot - 4 |
| 15. GlaxoSmithKline [EU] | 50% - 8 of 16 from 8 Co.; 2 d/c | 13 ww/1 EU; Mab - 4, Vac - 10 |
| 16. AbbVie | 93.4% - 14 of 15 Co,; 3 d/c | 10 ww/2 EU; Mab - 8, Pep - 3, Prot - 1 |
| 17. SOBI [EU] | 100% - 14 of 14 from 9 Co. | 12 ww/2 EU; Mab - 3, Oligo - 2, Pep - 3, Prot - 6 |
| 18. Merck KGaA [EU] | 100% - 12 of 12 from 3 Co.; 1 Out-lic.; 3 d/c | 8 ww; Mab - 2, Pep - 1, Prot - 5 |
| 19. Bristol Myers Squibb | 81.8% - 9 of 11 from 8 Co. | 11 ww; CT - 2, Mab - 6, Pep - 1, Prot – 2 |
| 20. Regeneron | 0% - 0 of 10 Co.; 1 Out-lic. | 9 ww; [Mab - 9 |
| 21. BioMarin | 0% - 0 of 7 Co. | 7 ww; GT- 1, Pep - 1, Prot - 5 |
| 22. Organon | 100% - 6 of 9 from 2 Co. | 9 ww; Mab - 5, Pep - 1, Prot – 3, Biosimilars - 6 |
| 23. Ipsen | 83.3% - 5 of 6 from 4 Co. | 6 ww; Lipo - 1, Pep - 2, Prot - 3 |
| 24. Bayer | 57.1% - 4 of 7 from 3 Co.; 1 d/c | 6 ww; Mab - 2, Prot - 4 |
| 25. Gilead | 100% - 5 of 5 from 4 Co.; 1 Out-lic | 4 ww; CT - 2, Lipo - 1, Mab - 1 |
| Rk | Top 25 Company Total M&A | Total $ Billions | # Co. M&A | Top 25 Largest M&A DealsBuyer & Acquired Company | Date | Amt. $ B |
| 1 | Pfizer | 138.05 | 35 | Bristol Myers Sq. – Celgene | 2019 | 74 |
| 2 | AbbVie | 114.19 | 8 | Pfizer – Wyeth | 2009 | 68 |
| 3 | Merck | 106.05 | 27 | Takeda – Shire | 2018 | 64 |
| 4 | Bristol Myers Sq. | 93.75 | 16 | AbbVie – Allergan | 2019 | 63 |
| 5 | Roche | 86.61 | 29 | Roche – Genentech | 1990/‘09 | 49 |
| 6 | Takeda | 80.43 | 12 | Pfizer – Seagen | 2023 | 43 |
| 7 | Amgen | 76.26 | 19 | Merck – Schering Plough | 2009 | 41 |
| 8 | AstraZeneca | 66.22 | 20 | AstraZeneca – Alexion | 2020 | 39 |
| 9 | Gilead | 62.71 | 19 | Shire – Baxalta | 2016 | 32 |
| 10 | Sanofi | 61.75 | 25 | AbbVie – Pharmacyclics | 2015 | 31 |
| 11 | Shire* | 57.83 | 15 | Amgen – Horizon | 2022 | 24 |
| 12 | Novartis | 55.96 | 26 | Bayer – Schering AG | 2006 | 21.5 |
| 13 | Johnson & Jhnsn | 34.01 | 16 | Gilead – Immunomedics | 2020 | 21 |
| 14 | Bayer | 26.83 | 8 | Sanofi – Genzyme | 2011 | 20 |
| 15 | Celgene* | 26.09 | 10 | Amgen – Immunex | 2002 | 16 |
| 16 | Eli Lilly | 18.33 | 17 | AstraZeneca – MedImmune | 2007 | 15.6 |
| 17 | Teva | 16.43 | 5 | Schering Plough – Organon | 2007 | 14.4 |
| 18 | Astellas | 16.31 | 12 | Pfizer – Medivation | 2016 | 14 |
| 19 | Merck KGaA | 15.43 | 8 | Merck KGaA – Serono | 2007 | 13.3 |
| 20 | Schering Plough* | 14.46 | 2 | Gilead – Kite | 2017 | 11.9 |
| 21 | GlaxoSmithKline | 14.18 | 15 | CSL Behring – Vifor Pharma | 2021 | 11.7 |
| 22 | CSL Behring | 12.82 | 5 | Sanofi – Bioverativ | 2018 | 11.6 |
| 23 | Perrigo | 8.60 | 1 | Merck – Acceleron | 2021 | 11.5 |
| 24 | UCB | 7.96 | 7 | Gilead – Pharmasset | 2013 | 11 |
| 25 | Novo Nordisk | 7.60 | 8 | Merck – Prometheus | 2023 | 10.8 |
| Johnson & J. – Alza | 2001 | 10.5 | ||||
| Amgen – Onyx | 2013 | 10.4 | ||||
| Top 25 Companies M&A = 365 biotech deals at a total cost of $1,215.5 B | AbbVie – ImmunoGen | 2023 | 10 | |||
| Top 28 M&A Deals @ 732.3 B | ||||||
| 4 Years “2006 to 2009” Bb M&As #10 @ $ 228 B | 6 Years “2019 to 2023” Bb M&As #11 @ $ 406 B |
| 2006 Merck KGaA – Serono $ 13.3 B | 2018 Takeda – Shire $ 64.0 B |
| 2006 Bayer – Schering AG $ 21.5 B | 2019 Novartis - #2 AxeVis & TMC $18.4 B |
| 2006 Novartis – Chiron $ 5.4 B | 2019 AbbVie – Allergan $ 63.0 B |
| 2007 Schering Plough – Organon $ 14.4 B | 2019 Takeda – Shire $ 62.0 B |
| 2007 AstraZeneca – MedImmune $ 15.6 B | 2019 Bristol Myers Squibb – Celgene $ 74.0 B |
| 2008 Takeda – Millennium $ 8.8 B | 2020 Gilead – Immunomedics $ 21.0 B |
| 2008 Eli Lilly – Imclone $ 6.1 B | 2021 AstraZeneca – Alexion $ 39.0 B |
| 2009 Pfizer – Wyeth $ 68.0 B | 2021 Merck-Acceleron $ 11.5 B |
| 2009 Roche – Genentech [50%] $ 47.0 B | 2023 Pfizer – Seagen $ 43.0 B |
| 2009 Merck – Schering Plough $ 41.1 B | 2023 AbbVie – ImmunoGen $10.1 B |
| In above 11 Years, only 12 companies did 21 deals = 5.13% of all deals but 51% of Total costs;Acquisitions done by 11 of top 25 biotech companies (Research & Sales) over these 11 years | |
| Company: | 2010 | 2015 | 2020 | 2023 | Rk $ 2023 | Ph. 3 #P 2023 | Rank #P 2023 |
| AbbVie | 2.50 | 4.29 | 6.56 | 7.67 | 10 | 10 | 12 |
| Amgen B | 3.26 | 4.07 | 4.21 | 4.78 | 16 | 22 | 3 |
| AstraZeneca EU | 5.32 | 5.60 | 5.99 | 10.94 | 5 | 22 | 4 |
| Bayer EU | 2.43 | 2.56 | 3.13 | 1.93 | 19 | 3 | 20 |
| Biogen B | 1.25 | 2.01 | 3.99 | 2.46 | 18 | 7 | 16 |
| BioMarin B | .214 | .635 | .628 | .747 | 24 | 3 | 24 |
| Bristol Myers Sq. | 3.57 | 5.92 | 11.14 | 9.30 | 8 | 12 | 11 |
| Eli Lilly | 4.88 | 4.80 | 6.09 | 9.31 | 7 | 10 | 13 |
| Gilead | 1.07 | 3.01 | 5.04 | 5.72 | 13 | 9 | 14 |
| GlaxoSmithKline EU | 5.60 | 5.45 | 6.59 | 7.72 | 9 | 14 | 9 |
| Ipsen EU | .332 | .212 | .474 | .700 | 25 | 3 | 25 |
| Johnson Johnson | 6.80 | 9.00 | 12.09 | 15.10 | 2 | 15 | 6 |
| Kyowa Kirin B Jp | ----- | .394 | .492 | .566 | 26 | 5 | 21 |
| Merck | 8.59 | 6.70 | 13.56 | 30.53 | 1 | 15 | 7 |
| Merck KGaA | 1.58 | 1.44 | 1.92 | 1.79 | 20 | 3 | 26 |
| Moderna B | ----- | ----- | 1.37 | 4.85 | 15 | 5 | 18 |
| Novartis EU | 6.15 | 8.94 | 8.89 | 11.37 | 4 | 27 | 1 |
| Novo Nordisk B EU | 1.72 | 2.02 | 2.37 | 5.00 | 14 | 8 | 15 |
| Pfizer | 9.41 | 7.65 | 9.41 | 10.58 | 6 | 20 | 5 |
| Regeneron B | .490 | 1.62 | 2.74 | 4.44 | 17 | 13 | 10 |
| Roche B EU | 8.70 | 8.03 | 11.34 | 14.70 | 3 | 25 | 2 |
| Sanofi EU | 6.05 | 5.78 | 5.87 | 7.04 | 11 | 15 | 8 |
| Seattle Genetics B | .146 | .295 | .825 | 1.21 | 22 | 3 | 27 |
| SOBI EU | ----- | .061 | .174 | .267 | 27 | 4 | 22 |
| Takeda Jp | 2.6 es | 2.88 | 4.29 | 6.80 | 12 | 6 | 17 |
| Teva Isr | .953 | 1.53 | .977 | .953 | 23 | 4 | 23 |
| UCB EU | .936 | 1.14 | 1.83 | 1.76 | 21 | 4 | 19 |
| Annual Total $USD | 83.40 | 90.18 | 124.12 | 163.07 | 283 |
| Rk | Product Use | Sales WW | No. Yrs. | Company | Rk | Product Use | Sales WW | No. Yrs. | Company |
| 1 | Humira Im | 180.9 | 21 | Abt/AbbVie/Eis | 14 | Opdivo On | 62.1 | 10 | Bristol My. Sq. |
| 2 | Rituxan On | 147.7 | 27 | Gen/Roche/Bgn | 15 | Copaxone N | 58.9 | 25 | Teva/Sanofi |
| 3 | Enbrel D/Rh | 138.9 | 26 | Imx/Wye/Amg/Pzr | 16 | Prevnar ID | 58.2 | 24 | Pfizer/Wyeth |
| 4 | Remicade Im | 130.7 | 25 | Jnsn &J/Mrk/Mit | 17 | Lucentis Oph | 55.4 | 18 | Roche/Novartis |
| 5 | Herceptin On | 104.6 | 26 | Genen/Roche | 18 | Gardasil ID | 53.3 | 18 | Merck |
| 6 | Avastin On | 103.2 | 20 | Genen/Roche | 19 | Novolins* E | 51.4 | 28 | Novo Nordisk |
| 7 | Keytruda On | 101.0 | 10 | Merck | 20 | ProCrit* H/On | 49.9 | 28 | Johnson & Jnsn |
| 8 | Comirnaty ID | 95.0 | 3 | Pfizer/BioNTech | 21 | Botox D/N | 49.6 | 26 | Allrgn/AbbV |
| 9 | Lantus E | 84.2 | 24 | Sanofi | 22 | Aranesp H/On | 46.4 | 23 | Amgen |
| 10 | Eylea Oph | 80.5 | 13 | Regeneron/Bayer | 23 | Humalogs* E | 45.6 | 26 | Eli Lilly |
| 11 | Epogen H/On | 71.3 | 34 | Amgen | 24 | Avonex N | 42.7 | 26 | Biogen |
| 12 | Stelara Im | 66.2 | 14 | Johnson & Jhnsn | 25 | NovoRapid E | 40.7 | 23 | Novo Nordisk |
| 13 | Neulasta On | 65.8 | 22 | Amgen | |||||
| Rk | Company Use | Sales WW | No. Yrs. | Company | Rk | Product Use | Sales WW | No. Yrs. | Company |
| 26 | SpikeVax ID | 42.6 | 3 | Moderna | 39 | Cosentyx Rh | 28.1 | 9 | Novartis |
| 27 | Xolair P | 38.0 | 21 | Roche/Novartis | 40 | Prolia Gyn/Op | 27.7 | 14 | Amgen |
| 28 | Trulicity E | 37.0 | 10 | Eli Lilly | 41 | Actemra Rh | 26.9 | 14 | Roche |
| 29 | Soliris H | 36.6 | 17 | Alex/AstraZeneca | 42 | Humulins* E | 24.9 | 43 | Eli Lilly |
| 30 | Rebif N | 34.7 | 22 | Merck KGaA | 43 | NovoSeven H | 24.9 | 25 | Novo Nordisk |
| 31 | Darzalex On | 32.3 | 8 | Johnson & Jhnsn | 44 | NovoMix E | 22.0 | 24 | Novo Nordisk |
| 32 | Ozempic E/IM | 32.7 | 6 | Novo Nordisk | 45 | Dupixent D/P | 21.6 | 7 | Sanofi/Regen. |
| 33 | Simponi Rh | 31.6 | 15 | Johnson & Jhnsn | 46 | Forteo Gyn/Op | 21.5 | 23 | Eli Lilly |
| 34 | Orencia Rh | 31.3 | 19 | Bristol My. Sq. | 47 | Entyvio GE | 21.2 | 10 | Takeda |
| 35 | Victoza E | 31.1 | 14 | Novo Nordisk | 48 | Sandost.* On/E | 20.9 | 25 | Novartis |
| 36 | Perjeta On | 30.1 | 12 | Roche | 49 | Levemir E | 19.8 | 19 | Novo Nordisk |
| 37 | NeoRecor. H/On | 29.5 | 27 | Roche | 50 | Xgeva On | 19.7 | 13 | Amgen |
| 38 | Tysabri N | 28.3 | 19 | Biogen |
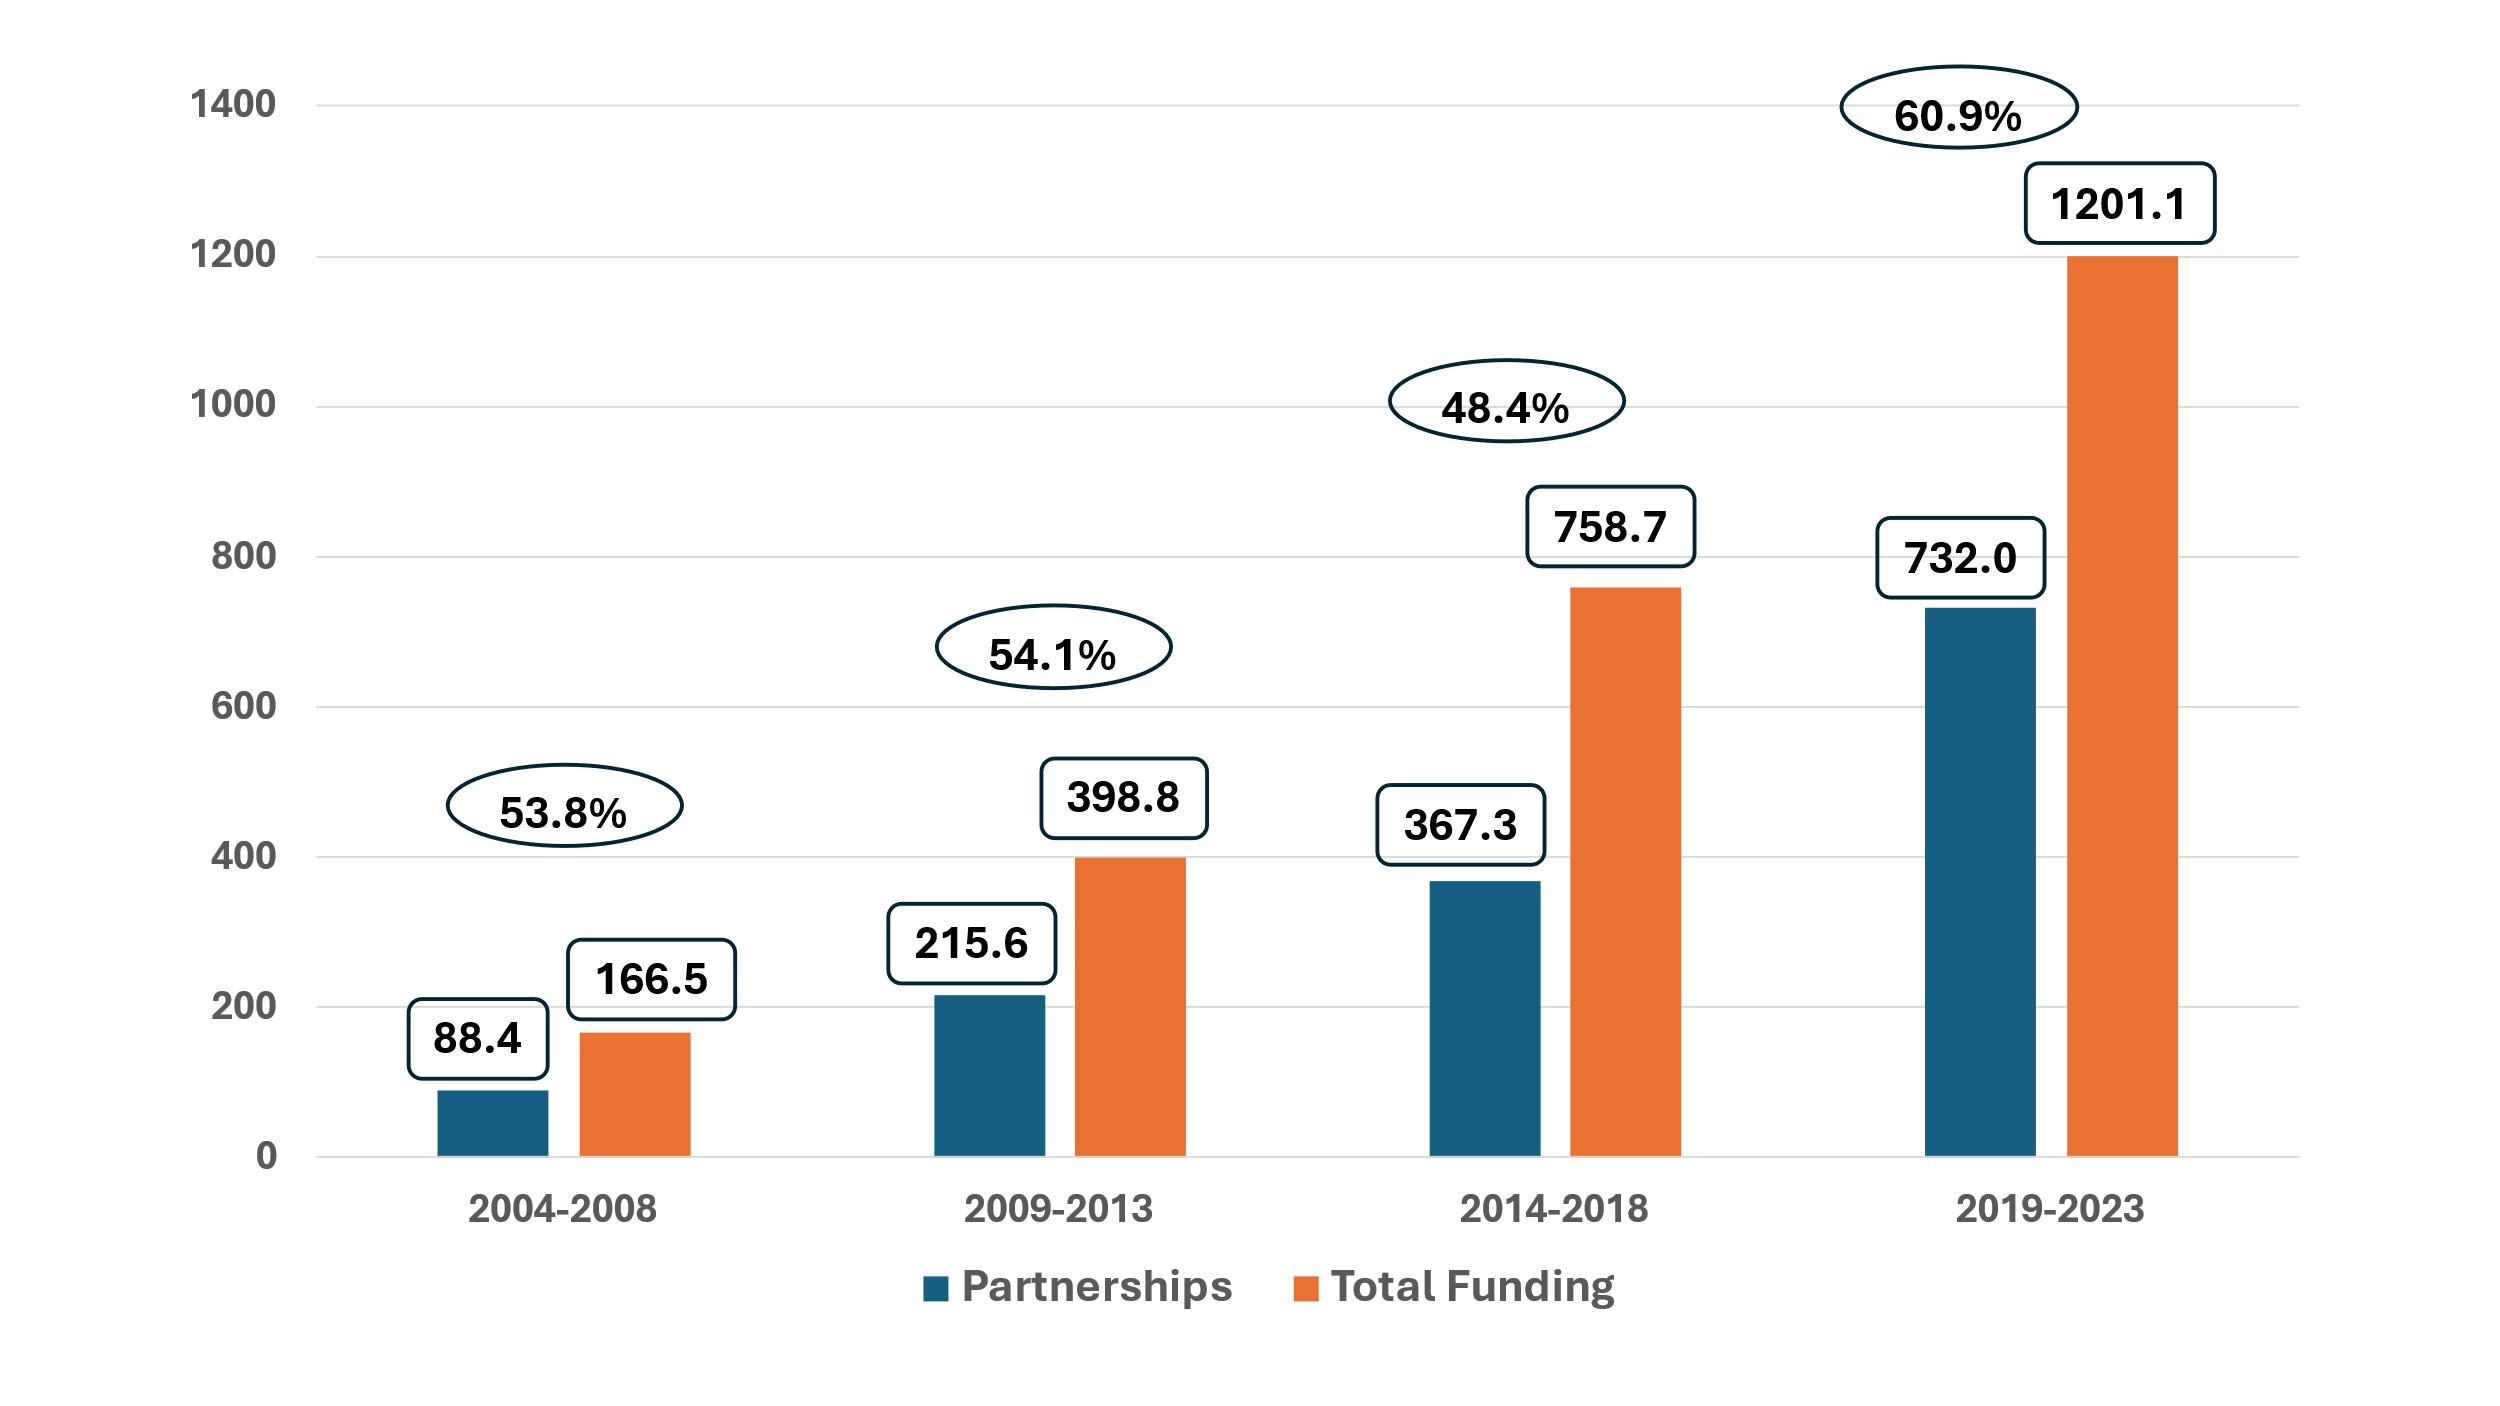 |
| Graph 1: Pharma Partnership Funding of Biotech Companies for Access to New Products |
Introduction
Biotech products [about 742] are currently marketed by 194 companies in United States and Europe, plus 89 other companies marketed products initially and were acquired later or out-licensed their products. Also, 272 companies have been engaged in the discovery of molecules that became marketed biotech products from 1982 to 2024, including 117 companies that were acquired later. The main premise of this 77manuscript is that new biotech product discoveries leading to marketed products remain substantially the responsibility of and outcomes for biotech companies with extensive pharma company collaboration. Pharma companies acquire products and follow-up with product development, approvals, and marketing. Also, they commonly execute acquisitions of biotech companies to obtain new products and technologies. The topics to be addressed here-in include the top 25 companies marketing biotech therapeutics from early years of 1990s up to present time, the discovery of molecules, the marketing companies for biotech products [established versus new companies; in-house research and development of molecules versus in-licensing and acquisitions], the top companies’ product sales and types of molecules, mergers and acquisitions [who, when, how much]. The data sources are the author’s biotechnology databases [#25] covering 35 years to the present, addressing biotech products, types of molecules, worldwide companies, sales [products, companies, worldwide], research and development [late stage, expenditures], approvals in Europe and United states, usage areas, mergers and acquisitions, novel molecules, and biosimilars.
For context, a biotechnology product addressed here-in is defined by one of the following ten categories for product creation, 1. proteins [recombinant], 2. & 3. peptides [recombinant and molecularly engineered], 4. monoclonal antibodies including fragments and conjugates, 5. & 6. vaccines [recombinant or novel biotech processes], 7. oligonucleotides, 8. gene therapies, 9. liposomal molecules, and 10. cell therapies. Extracts of existing biological entities or naturally occurring substances are not included.
Top 25 Companies for Biotechnology Therapeutics
From 2000 to 2023, the top 25 companies engaged in biotechnology evolved significantly as displayed in Table 1 below in these 5-Year windows of biotech sales. Their total biotech sales reached a total of $430 billion by 2023 from $48 billion in 2000. The top company, Roche, had $3.82 billion in sales in 2000 rising to $42 billion in 2023]. For all these 24 years, five companies consistently were listed in top 10 [Amgen, Eli Lilly, Johnson & Johnson, Novo Nordisk, Roche] related to their internal discovery and acquisitions. In year 2010 and beyond, more companies achieved top 10 status especially through acquisitions; by 2010 for Novartis, Pfizer, and Sanofi; by 2015 for AbbVie; by 2020 for Bristol Myers Squibb and Takeda. For a further historical comparison, 1995 worldwide biotech sales were estimated to be about $6-7 billion for 50 products. In 1990s, top 15 companies in sales & research in biotech were 9 biotech leaders [Amgen, Biogen, Chiron, Genentech, Genzyme, Immunex, MedImmune, Novo Nordisk, and Serono] and 6 pharma early engagers [Eli Lilly, Johnson & Johnson, Roche, Schering AG, Schering Plough, and Wyeth]. Roche became a biotech company in 1990s through a unique research and marketing arrangement with the acquisition of Genentech, the most productive biotech company in the world creating over 20 distinct products in 1970s to 1990s. Roche bought 50% of the company in 1990 for $2 billion and obtained the right of first refusal for any new molecule for worldwide sales, while Genentech continued to function independently. In 2009, Roche purchased the remaining half for $47 billion for full control and integration.
Bold print in the table 1 designates a biotech company [#26]. Italic print designates a company that was acquired at a later date [#17]. Over 2000 to 2023, 47 companies achieved top 25 status. The top 2 companies were consistently Roche, which was ranked 1st or 2nd in sales over these years, and Amgen was 1st, 2nd , 3rd, and 8th. Novo Nordisk was the third best biotech sales company, ranking 3th, 4th, or 5th. Johnson & Johnson and Eli Lilly did well ranked as the 4th and 5th best companies. Two companies jumped into the top of sales, based mostly on extensive sales of a single product, AbbVie with Humira by 2015 and Merck with Keytruda by 2020. Pfizer attained high ranks of 4th to 12th over time. GlaxoSmithKline reached modest status of 11th to 19th through these 24 years, and Bayer reached lower levels of 16th to 23th.
Over these 24 years for the 47 companies achieving top 25 company status for biotech product sales, 27 were based in USA, 15 in Europe, 4 in Japan, and one in Israel. The table also provides the total number of products marketed by the top 25 companies with their total sales for each year identified. The total sales by these top 25 companies started in 2000 at $29.7 billion for 53 products, and then 23 years later reached $420 billion for their 267 products in 2023. The top 25 company worldwide biotech sales were at least 85% of all company all product sales for all timeframes, while the total number of products for top 25 versus all companies ranged from 40% in 2023 to 69% in 2000. The percentage of the number of top 25 companies versus all companies with a biotech product started at 83.8% in 2000 and moved down to 12.9% in 2023.
The top companies in biotech sales can also be represented by total company sales for all their biotech products over time for 1998 to 2023 [see table 2]. Total biotech sales for the top 30 companies for these 25 years was $3.963 trillion for about 375 products. The top five companies are Roche, Amgen, Novo Nordisk, Johnson & Johnson, and Pfizer. Table 2 also lists their number of biotech products per company and their ranking for 2023; top 5 are Sanofi-42, Pfizer-40, Roche-32, Amgen-30 and Takeda-28. For worldwide biosimilar biotech products [biotech copies], they number 118 from 40 companies, led by biosimilar specialists (Samsung Bioepis- 15, Biocon-7, Celltrion-8 ) and top 25 companies (Sandoz-15, Pfizer -14, Amgen-8), plus Organon-7.
The sales numbers for the 16 prior early years [1982 to 1997] are not included as the old data has not been reliably maintained. However, the 1995 biotech sales for all companies was estimated to be about $6-7 billion. In the 16 years, the top 10 biotech sales companies were Amgen, Chiron, Eli Lilly, Genentech, Johnson & Johnson, Novo Nordisk, Roche, Schering AG, Schering Plough, and Wyeth. In 1992, 14 products had costs of $4.42 billion per report in Nature Biotechnology 1993.
Company Sponsors for FDA approvals – Top 25 Companies versus New Companies
New biotech product approvals over last 10 years were done by the top 25 companies at 46.9% of all biotech approvals. New companies marketing their first or second product were 11% to 33% of total approvals and above 30% over last 4 years. Table 3 also shows number and percent of biotech vs drug approvals for novel molecules/products. Biotech eventually achieved above 50% for novel product approvals versus drugs.
History [1970-1999] of Biotechnology Companies & Discovery of Marketed Biotech Products
Prior to 2000, biotech companies initially were founded in the 1970s and 1980s. Out of the 272 companies that have discovered and created new molecules and eventually marketed products, 53 biotech companies were founded [with their date provided] in the early days of biotechnology development before 2000 [see table 4]. These companies discovered and researched 194 products that eventually became approved products in the United States and Europe, about 28% of all product approvals [USA & EU]. Their technologies and products were potentially so valuable to science, patients, and the pharma biotech industry, such that 38 of these early companies were acquired [71.7%] [indicated by italic print]. Listed below in table 4 are the companies and dates of founding along with the number of products discovered and later marketed [FDA approvals in brackets]. In table 5, Genentech is shown to be most successful biotech company, discovering and developing 24 biotech products. Genentech created the first biotech recombinant molecules, human recombinant insulins for Diabetes mellitus [Humulin out-licensed to Eli Lilly], hepatitis B vaccine [Engerix-B to GlaxoSmithKline], factor eight protein for hemophilia [Kogenate to Bayer], somatropin growth hormone [Genotropin to Pharmacia/Upjohn], and 20 other molecules/products licensed to Roche. Amgen ranks second discovering 16 molecules/products, followed by Genzyme, Biogen, Shire, Regeneron and Serono. A novel problem for somatropin, developed by Genentech, was poor patent coverage that allowed a variety of companies also to develop and market growth hormone products [e.g., Protropin - Roche, Humatrope - Eli Lilly, Norditropin - Novo Nordisk]. Collaborations between the early biotech companies was common, sharing technologies for molecule creation, e.g., Cambridge Antibody Technology (CAT) with Human Genome Sciences, CAT with MedImmune, Biogen with Genentech. Six of these biotech companies were primarily collaborators providing an added technology in creating the molecules along with the primary discovery company, e.g., pegylation, antibody molecular engineering [e.g., humanization], use of liposomes, delivery systems, such as Elan, Enzon, Nektar, NeXstar, Protein Design Labs, and Tanox. For other biotech companies founding post 1999, they have numbered #117 companies and have created #132 products. Eight leading pharma companies with biotech molecule/product creation [internally not acquisitions] are Novartis [14 products], Eli Lilly [12], Sanofi [11], Pfizer [7], Merck [7] GlaxoSmithKline [5]; plus biotech companies - Novo Nordisk [17] and Roche [13]; they total 86 products originally created. However, these 8 companies market many more products, actually 218 biotech products, especially through acquisitions.
In-Licensing & Product Acquisitions
One hundred companies have out-licensed 298 molecules [318 products later marketed] to the 250 companies marketing a biotech product. Table 6 below lists the top 25 companies engaged in biotech R&D and marketing with the number of their total products, along with the in-licensed products [the number of acquisitions], and number of companies providing products for the acquisitions. Also, the types of molecules for their biotech marketed products are provided.
The top 25 biotech therapeutics companies market 439 biotech products. Overall acquisitions were 69.4% of all products they market. As shown in table 5, product acquisitions by a company were 75% to 100% of their products for 14 companies, 34% to 72% for 7 companies and 0% to 8% for 4 companies. All of their biotech products [100%] were acquired for AstraZeneca, Gilead, Merck KGaA, and Takeda. The majority of pharma companies, 14 in top 25, in-licensed at least 79.4% of their products. Sandoz previously a division of Novartis distinguished itself with two-thirds of their products being second generation biotech products via biosimilars. Ipsen and SOBI in Europe are both biotech and pharma companies. Organon experienced unique events being acquired by Schering Plough in 2007, which was acquired by Merck in 2009, and then Merck made them a separate company again in 2022. Co-marketing is done for 24 products by top 25. Products discontinued from marketing number 31 by top 25. Seven companies collaborate in the creation of biotech products through their adjunctive technologies, such as pegylation, liposomes, molecular engineering, humanization of antibodies, conjugates, and drug delivery systems [Alza, Elan, Enzon, Halozyme, Nektar, PDL Biopharma, and Tanox].
Product categories for the top 25 companies for all their biotech products represent the full array of molecular types and are in order of number of products, led by monoclonal antibodies, as follows; 1. Monoclonal Antibodies – 149 products, 2. Proteins – 117, 3. Peptides – 82, 4. Vaccines – 28, 5. Cell Therapy – 8, 6. Oligonucleotides – 8, 7. Liposomal – 4, 8. Gene Therapies – 2, 9. Carbohydrate – 1, 10. Hyaluronidase – 1. Biotech product development started with proteins and peptides, which continues to today. Monoclonal antibodies became a primary and leading focus for the biotech and pharma industry, as they were able to find specific disease targets for a disease and advance efficacy substantially, along with a major source of product sales. Vaccine products have continued be disease control advancements throughout the history of biotechnology. Additional new areas of product categories with novel technologies and new disease advancements are cell therapies and gene therapies in last 10 years. Also, Biosimlar products are copies of the original novel molecules, and for the last ten years they are major product approvals around world with over 100 products now approved for over 20 product/molecules.
The product categories for the leading companies follows; Mab Companies: Roche – 22 products, Pfizer – 16, Amgen – 16, Sanofi – 12, Novartis – 11, Johnson & Jhsn – 10, Biogen – 9, Regeneron – 8; Protein Companies: Sanofi – 15, Takeda – 15, Pfizer – 12, Amgen – 8, Roche – 7, Novo Nordisk – 7; Peptide Companies: Novo Nordisk – 17, Eli Lilly – 15, Sandoz – 10, Sanofi – 9; Vaccine Companies: GlaxoSmithKline – 9, Merck – 7, Pfizer – 6, Sanofi – 6.
Mergers & Acquisition of Biotech Companies
The top 25 pharma and biotech companies have acquired 365 biotech companies at a cost of $1.216 trillion. Top five companies have spent over $95 billion each, as displayed in Table 7, led by Pfizer at $138.1 billion, followed by AbbVie, Merck, Bristol Myers Squibb, and Roche. The number of deals conducted by each company is presented. Table seven also presents the top 25 acquisition deals [conducted by 17 companies], based on cost with the date of the deal and their costs are provided. Deals from a minimum of $10 billion are included up to $74 billion. These top 25 deals cost $732 billion, which is 60% of the cost for all 365 deals by all companies. In addition, table 8 demonstrates that the acquisition deals [M&A] for biotech access by pharma companies occurred especially in two waves [Early times: 2006 to 2009 & Later times: 2018 to 2023], comprising #10 deals by 10 companies costing $228 billion, and #11 deals by 8 companies costing $406 billion, respectively. These 21 M&A deals represent about half [52%] of the cost of all the M&A deals. Mergers and acquisitions, as well as the unique science, novel products, and newly treatable diseases, drove the overall biotech company development further by providing a major financial incentive for new company creation for new product types and new technologies.
Research Investments by Top 25 Companies for Biotech Engagement
Research and Development [R&D] costs for the top 25 biotech therapeutics companies reached $164 billion for 2023 from $83.4 billion in 2010, including both biotech product and drug [R&D}costs. Table 9 delineates the R&D costs for 5-year intervals from 2010 to 2023 for these top companies, along with the number of biotech molecules in late phase research at these companies. The total number of late-stage phase 3 biotech molecules is currently 283 [12/2023]. The top 5 companies are Novartis [27 molecules], Roche [25], Amgen [22], AstraZeneca [22], and Pfizer [20], in order of number of molecules. The next group [#6 - #10] are Johnson & Johnson [15], Merck [15], Sanofi [15], GlaxoSmithKline [14], and Regeneron [13]. The top companies in R&D costs are Merck, Johnson & Johnson, Roche, and Novartis, followed by AstraZeneca, Eli Lilly, Bristol Myers Squibb, GlaxoSmithKline, AbbVie, and Sanofi. In addition, pharma company investments in biotechnology companies involves financial partnerships in research and development, where-in the pharma company gains access to new molecules. The company funds research from early preclinical work or from clinical trials through filing with regulatory authorities for a molecule and then shares or acquires patents and marketing rights for a single or more molecules. Graph 1 presents partnership funding from all pharma to all biotech companies in 5-year windows of time over 2004 to 2023 in comparison to total funding received by biotechnology industry. In general, about half of all revenues to biotech comes from these pharma partnerships. Funding was $11 to $22 million in 2004 to 2008 and rose to $102 to $235 million in 2020 to 2023. See graph 1 below [Source: Nature Biotechnology journal February issues for Years - 2005 to 2024].
Top 50 Biotech Products Cumulative Sales
Another measure of product and company success are the top 50 biotech products, as measured by their cumulative sales from product launch up to December 31,2023. Table 10 presents the top 50 products, along with their usage area, the number of years on the market, and the companies marketing the products. The types of molecules are Monoclonal antibodies – 21, Proteins – 13, Peptides – 12, and Vaccines – 4. Medical usage areas with number of products and total category costs are Oncology – 12 products [$732], Endocrinology [Diabetes mellitus] – 11 [$368], Hematology – 6 [$113], Neurology – 5 [$200], Infectious disease – 4 [$259], Gastroenterology – 3 [#156], and Ophthalmology [$135]. Immune disorders with a product being used for Dermatology [5], Gastroenterology [3], and Rheumatology [7] include Humira, Remicade and Stelara. The company ranking in number of products is led by Roche [#1 - 8 products], followed by Amgen #2 [6], Novo Nordisk #3 [5], Johnson & Johnson #4 [5], Eli Lilly #5 [4], Novartis #6 [4], Pfizer #7 [3], Merck #8 [3], followed by Biogen [2], Bristol Myers Squibb [2], Sanofi [2], and Regeneron [2]. Biotech companies number #11 with 29 products and pharma #17 with 29 products; Co-marketing by two or more companies is done with nine products. Total worldwide cumulative sales for top 25 products = $1,984.2 Billion for 27 companies. Bold print indicates a biotech company. Total Worldwide cumulative sales for top 26-50 products are $774.0 billion for 14 companies. All abbreviations are defined in the key below for table 10.
Summary of Top 25 Companies with Biotechnology Therapeutics
The top companies are presented for biotech therapeutics, based on sales and number of products, for 2000 to 2023, along with a historical description for 1970s to 1999. The overall biotech leaders have been Amgen, Novo Nordisk, and Roche, who are all biotech companies, covering the last 40 years up to the present. The pharma companies with major biotech commitments over this full timeframe have been Eli Lilly, GlaxoSmithKline, Johnson and Johnson, Novartis, Pfizer, and Sanofi. Other companies with substantial biotech success have been AbbVie, Bristol Myers Squibb, and Takeda. Internal discovery of biotech products has been led by Amgen, Genentech, Novo Nordisk, Roche, and Serono. Biotech companies beyond the top 25 with successful product development also include Alnylam, Biogen, BioMarin, Ionis, Regeneron, and Sarepta. In addition to research and marketing partnerships between pharma and biotech companies, product acquisitions through mergers and acquisitions have been enormous for the pharma and biotech industries with over one trillion dollars spent for over 350 companies. Acquisitions of products and companies was led by AstraZeneca, Bristol Myers Squibb, Johnson & Johnson, Merck, Merck KGaA, Novartis, Pfizer, and Takeda, with 70% plus of their products acquired from other companies. The types of products for disease control advancements continues to expand substantially with more proteins, peptides, vaccines, and especially monoclonal antibodies, but also new novel therapies as well with cell therapies, oligonucleotides, and gene therapies. Biosimilar product development has been led by specialty companies [Biocon, Celltrion, Samsung Bioepis], along with Amgen, Organon, Pfizer, and Sandoz, creating competition in the health care markets and cost savings.
References
- The sources for data and discussions for this manuscript are the databases created and maintained by the author, Dr. Ronald P. Evens, regarding biotechnology [molecules, products, companies, and FDA approvals]. The data sources for the databases are the annual reports of the companies, annual FDA and EMA product approvals, and product package inserts from 1990s to the present.
Article Information
Research Article
Received Date: October 20, 2024
Accepted Date: November 20, 2024
Published Date: November 23, 2024
Top 25 Companies with Biotech Therapeutics – Biotech Companies Remain Mainstay for New Product Success along with Pharma Collaboration
Volume 2 | Issue 1
Citation
Ronald P. Evens (2024) Top 25 Companies with Biotech Therapeutics – Biotech Companies Remain Mainstay for New Product Success along with Pharma Collaboration. Int J Biotech Bio App 2: 1-15
Copyright
©2024 Ronald P. Evens. This is an open-access article distributed under the terms of the Creative Commons Attribution License, which permits unrestricted use, distribution, and reproduction in any medium, provided the original author and source are credited.

doi: jbba.2024.2.102