

Review Article
Volume-2 Issue-1, 2022
Influence of Community Resilience to Flood Risk and Coping Strategies in Bayelsa State, Southern Nigeria
-
Received Date: October 05, 2022
-
Accepted Date: November 05, 2022
-
Published Date: November 09, 2022
Journal Information
Abstract
This study is aimed at assessing the influence of community resilience to flood risk and coping strategies in Bayelsa State, Southern Nigeria. 1505 copies of administrative questionnaires were distributed to obtain information concerning the perception of flood vulnerability and resilience in carefully chosen communities applying stratified and random sampling techniques. However, 1265 questionnaires were repossessed for further analysis and the results indicated that incident of flooding in Bayelsa is seemly a recurring problem occurring yearly with loss of numerous lives and properties. The predominant coping strategies are sandbag dykes' construction, channel/ drainage building, opening/maintenance of clogged drains/channels, land reclamation, elevating buildings floor beyond water level, relocation and elevation of belongings from ground floor. This study also revealed that 43 (11.05%) communities recorded low flood vulnerability levels, about 287 (73.78%) communities had moderate vulnerability features whereas 59 (15.17%) communities indicated high vulnerability to floods in the State. The study concluded that greater portion of Bayelsa State were vulnerable to flooding. Encouragement of periodic flood assessment studies as well as provision of adequate preparedness plan to surmount future occurrence of flood disaster in communities that are highly and moderately vulnerable to floods is recommended. Timely intervention by government agencies to assist flood victims in the State is necessary
Key words
Resilience; flood risk; vulnerability; coping strategies; Bayelsa State
LGA and Selected Areas |
No of Sampled Households |
Brass LGA |
|
Twon Brass |
34 |
Okpoama |
26 |
Odioma |
30 |
Sangana |
21 |
Ewoama |
26 |
Total |
137 |
Ogbia LGA |
|
Ogbia Town |
26 |
Otuokpoti |
31 |
Kolo Town |
26 |
Opume |
31 |
Imiringi |
31 |
Total |
145 |
Southern Ijaw LGA |
|
Ammasoma |
44 |
Oporoma |
44 |
Ekowe |
26 |
Ukubie |
31 |
Azuzuama |
44 |
Total |
189 |
keremor LGA |
|
Aleibiri |
44 |
Ekeremor |
44 |
Agoro |
26 |
Peretorugbene |
44 |
Isampou |
34 |
Total |
192 |
Kolokuma/Opokuma LGA |
|
Odi |
44 |
Kaiama |
87 |
Opokuma |
31 |
Sabagreia |
31 |
Igbedi |
26 |
Total |
219 |
Sagbama LGA |
|
Trofani |
26 |
Sagbama |
44 |
Toru- Ebeni |
34 |
Ebedebiri |
31 |
Adagbabiri |
26 |
Total |
161 |
Yenagoa LGA |
|
Yenagoa Town |
65 |
Obunagha |
26 |
TombiaEkpetiama |
34 |
Biseni |
60 |
Edepie |
56 |
Total |
241 |
Nembe LGA |
|
Ogbolomabiri |
60 |
Bassambiri |
44 |
Fantuo |
|
Olodiama |
31 |
Okoroama |
34 |
Akukumama |
26 |
Total |
221 |
Areas |
Administered Questionnaires |
Retrieved Questionnaire |
Twon Brass |
34 |
29 |
Okpoama |
26 |
26 |
Odioma |
30 |
27 |
Sangana |
21 |
19 |
Ewoama |
26 |
22 |
Ogbia Town |
26 |
21 |
Otuokpoti |
31 |
27 |
Kolo Town |
26 |
23 |
Opume |
31 |
25 |
Imiringi |
31 |
28 |
Ammasoma |
44 |
38 |
Oporoma |
44 |
31 |
Ekowe |
26 |
23 |
Ukubie |
31 |
21 |
Azuzuama |
44 |
37 |
Aleibiri |
44 |
34 |
Ekeremor |
44 |
33 |
Agoro |
26 |
23 |
Peretorugbene |
44 |
38 |
Isampou |
34 |
30 |
Odi |
44 |
42 |
Kaiama |
87 |
62 |
Opokuma |
31 |
24 |
Sabagreia |
31 |
28 |
Igbedi |
26 |
25 |
Trofani |
26 |
21 |
Sagbama |
44 |
30 |
Toru Ebeni |
34 |
32 |
Ebedebiri |
31 |
27 |
Adagbabiri |
26 |
24 |
Yenagoa Town |
65 |
60 |
Obunagha |
26 |
26 |
TombiaEkpetiama |
34 |
32 |
Biseni |
60 |
54 |
Edepie |
56 |
48 |
Ogbolomabiri |
60 |
52 |
Bassambiri |
44 |
31 |
Fantuo |
26 |
20 |
Olodiama |
31 |
27 |
Okoroama |
34 |
25 |
Akukumama |
26 |
20 |
Total |
1505 |
1265 (84.1%) |
STATEMENT |
SA |
A |
N |
D |
SD |
Community resilience to flooding is influenced by the |
|
|
|
|
|
Availability of social networks (electricity, water, telephone) is a vital factor in community resilience building. |
418 |
572 |
88 |
154 |
33 |
Neighbors, friends and relatives support contribute to community resilience building. |
440 |
605 |
110 |
0 0 |
110 |
Geographical location of Housing units, business and industries, shelters/critical infrastructures influences resilience of communities. |
374 |
594 |
88 |
176 |
33 |
Access to physical infrastructure like roads, bridges, dams and levees as well as communication and transport facilities are essential factors for community resilience. |
374 |
605 |
143 |
121 |
22 |
Information and Knowledge acquired from past experiences concerning floods shared with neighbors, friends and relatives influence resilience of communities. |
682 |
418 |
77 |
88 |
00 |
Livelihoods pattern (type of employment, income level) contributes to community resilience. |
429 |
528 |
121 |
110 |
77 |
Educational level influences resilience |
528 |
528 |
77 |
121 |
11 |
Availability of Non-Governmental Organizations (NGOs) also influences resilience. |
495 |
440 |
66 |
176 |
88 |
What are the traditional (structural) flood resilience measures adopted in your locality in case of floods? |
SA |
A |
N |
D |
SD |
Sandbag dykes construction |
330 |
737 |
85 |
91 |
22 |
Building of earth dykes |
605 |
418 |
121 |
110 |
11 |
Channel/drainage building |
144 |
530 |
320 |
262 |
11 |
Clogged drains/channels opening and maintenance |
407 |
660 |
132 |
66 |
00 |
Land reclamation |
154 |
220 |
693 |
198 |
00 |
Structural stabilization |
143 |
539 |
319 |
253 |
11 |
Relocation |
649 |
319 |
165 |
132 |
00 |
Afforestation |
451 |
253 |
330 |
198 |
33 |
Elevation of buildings floor beyond the level of water. |
506 |
539 |
54 |
66 |
100 |
Elevation of belongings from ground floor |
572 |
451 |
77 |
121 |
44 |
lay flood guards at door steps |
110 |
319 |
627 |
143 |
66 |
Construct trenches in gardens to redirect flood water |
396 |
385 |
198 |
242 |
44 |
What are the Conventional (Non-structural) flood resilience measures adopted in your locality in case of floods? |
|
|
|
|
|
Programmes that raises awareness and orientation in communities (e.g. flood warning signals) |
495 |
396 |
154 |
176 |
44 |
Local preparedness plan development |
407 |
506 |
132 |
176 |
44 |
Establishment of Community flood Management committee’s implementation of local strategies. |
352 |
352 |
242 |
231 |
88 |
Flood plain regulations (that includes land use planning strategies) |
176 |
154 |
286 |
253 |
396 |
Provision of flood forecast-warning signals that is efficient. |
176 |
242 |
264 |
506 |
77 |
Flood risk assessment system |
99 |
264 |
176 |
429 |
297 |
Economic instruments |
484 |
231 |
132 |
330 |
88 |
Maintaining community drainage systems in existence as well |
275 |
605 |
143 |
220 |
22 |
Degree |
Frequency |
Percentage (%) |
High |
287 |
22.7 |
Low |
810 |
64.0 |
Unknown |
168 |
13.3 |
Total |
1265 |
100.0 |
STATEMENT |
SA |
A |
N |
D |
SD |
Sustainable flood resilience practices were adopted by individuals and communities during floods. |
517 |
528 |
66 |
133 |
21 |
Sustainable flood resilience measures embarked on by your community could be ranked as appropriate flood defences by forthcoming generations: |
|
|
|
|
|
Accessibility of Flood Management committee. |
352 |
748 |
66 |
75 |
24 |
Accessibility of Hazard/vulnerability Assessment reports. |
330 |
615 |
121 |
154 |
44 |
Accessibility of Community Awareness raising |
594 |
473 |
77 |
100 |
21 |
Local preparedness plan development |
473 |
484 |
143 |
110 |
55 |
Maintaining community drainage systems in existence to avoid blockage as well as building extra small scale ones. |
187 |
495 |
308 |
231 |
44 |
Provision of an effective flood forecast/warning signals. |
440 |
297 |
275 |
165 |
88 |
Elevation of building floors beyond the level of water. |
352 |
209 |
198 |
407 |
99 |
Building of sandbanks/earth dykes |
242 |
407 |
110 |
286 |
220 |
Adopted resilience measures could influence sustainability of floods in Bayelsa. |
220 |
561 |
121 |
209 |
154 |
STATEMENT |
SA |
A |
N |
D |
SD |
Social life in my community is impacted by flood. |
187 |
561 |
176 |
198 |
143 |
There was damage to health facilities resulting to health effects during the floods. |
397 |
308 |
54 |
275 |
231 |
Diseases were experienced by the household members who get sick |
|
|
|
|
|
(a)Diarrhoea |
319 |
484 |
33 |
264 |
165 |
(b)Malaria/fever |
385 |
619 |
63 |
148 |
50 |
(c)Cough |
473 |
451 |
89 |
132 |
120 |
(d)Skin diseases(Measles) |
539 |
528 |
121 |
66 |
11 |
Flood affected communities were isolated from public amenities like health centre, Youth clubs, community play grounds, schools, shops etc. |
429 |
693 |
99 |
30 |
14 |
Flood affected the schooling of children due to close down of schools. |
671 |
363 |
209 |
09 |
13 |
For how long were the schools closed down? |
|
|
|
|
|
a. One week |
319 |
385 |
471 |
46 |
44 |
b. Two weeks |
231 |
286 |
638 |
53 |
57 |
c. Three weeks |
781 |
241 |
34 |
77 |
132 |
d. Four weeks |
550 |
330 |
20 |
211 |
154 |
e. Five and above |
220 |
66 |
374 |
319 |
286 |
The economy of individuals/community is affected by the flood occurrence. |
SA |
A |
N |
D |
SD |
|
My house was damaged |
Very damage |
275 (21.7) |
132 |
539 |
132 |
187 (14.8) |
Slightly damaged |
451 (35.7) |
44 (3.5) |
11 (0.9) |
80 (6.3) |
118 (9.3) |
|
Not damaged |
286 (22.6) |
66 (5.2) |
594 |
165 |
154 (12.2) |
|
My belongings were damage |
Very damaged |
264 (20.9) |
132 |
594 |
165 |
110 (8.7) |
Slightly damaged |
396 (31.3) |
121 (9.7) |
592 |
57 (4.5) |
99 (7.8) |
|
Not damaged |
286 (22.6) |
66 (5.2) |
539 |
165 |
209 (16.6) |
|
Lost belongings due to damage by floods |
Furniture |
297 (23.5) |
220 |
418 |
132 |
198 (15.7) |
Clothes |
242 (19.1) |
187 |
517 |
154 |
165 (13.0) |
|
|
Utensils |
275 (21.7) |
166 |
484 |
155 |
185 (14.6) |
Bed and Mattresses |
297 (23.5) |
165 |
473 |
110 (8.7) |
220 (17.4) |
|
Refrigerator |
209 (16.5) |
164 |
496 |
110 (8.7) |
286 (22.6) |
|
TV set |
121 (9.6) |
132 |
583 |
153 |
276 (21.8) |
|
School materials |
187 (14.8) |
176 |
473 |
87 (6.9) |
342 (27.0) |
|
Motor bike |
199 (15.7) |
100 (7.9) |
495 |
155 |
316 (25.0) |
|
Other items of great values |
253 (20.0) |
363 |
220 |
231 |
198 (15.7) |
|
There was loss of life's during the floods |
|
374 (29.6) |
451 |
242 |
121 (9.6) |
77 (6.1) |
Lost daily wage. |
|
396 (31.3) |
506 |
231 |
60 (4.7) |
72 (5.7) |
Water and Electricity supply were disrupted. |
|
396 (31.3) |
550 |
253 |
44 (3.5) |
22 (1.7) |
Transport mode and communication to workplace and others was disrupted. |
|
385 (30.4) |
484 |
352 |
18 (1.4) |
26 (2.1) |
Ecosystem variables of communities were affected |
SA |
A |
N |
D |
SD |
Loss of livestock and habitats during floods |
429 |
495 |
308 |
22 |
11 |
Households experienced farms and crop damage during floods. |
308 |
429 |
289 |
177 |
65 |
Dispersal of weed species and invasive species |
396 |
374 |
275 |
150 |
70 |
Silting of ponds and lakes |
319 |
418 |
438 |
59 |
31 |
River bank and soil erosion |
638 |
77 |
550 |
00 |
00 |
Major coping measures (or strategies) adopted in the occurrence of floods |
SA |
A |
N |
D |
SD |
||||
Building of canals |
836 |
(66.1) |
33 |
(2.6) |
396 (31.3) |
0 |
(0.0) |
0 |
(0.0) |
Evacuation to higher/safer places |
759 |
(60.0) |
11 |
(0.9) |
495 (39.1) |
0 |
(0.0) |
0 |
(0.0) |
Construct sandbag dykes round building and beyond |
671 |
(53.0) |
0 |
(0.0) |
594 (47.0) |
0 |
(0.0) |
0 |
(0.0) |
Elevate the house floor |
660 |
(52.2) |
0 |
(0.0) |
605 (47.8) |
0 |
(0.0) |
0 |
(0.0) |
Lay flood guards at doorsteps |
660 |
(52.2) |
0 |
(0.0) |
605 (47.8) |
0 |
(0.0) |
0 |
(0.0) |
Construct trenches in gardens/farms to redirect flood water |
770 |
(60.9) |
0 |
(0.0) |
495 (39.1) |
0 |
(0.0) |
0 |
(0.0) |
Relocate to IDP camps |
649 |
(51.3) |
0 |
(0.0) |
616 (48.7) |
0 |
(0.0) |
0 |
(0.0) |
Relocate to neighbour/relatives home |
616 |
(48.7) |
0 |
(0.0) |
649 (51.3) |
0 |
(0.0) |
0 |
(0.0) |
Construct earth dykes on property or beyond |
704 |
(55.7) |
0 |
(0.0) |
561 (44.3) |
0 |
(0.0) |
0 |
(0.0) |
Pump water out of affected house |
638 |
(50.4) |
0 |
(0.0) |
627 (49.6) |
0 |
(0.0) |
0 |
(0.0) |
Evacuate properties out of affected house |
869 |
(68.7) |
0 |
(0.0) |
396 (31.3) |
0 |
(0.0) |
0 |
(0.0) |
Relocate pets and animals to safer grounds |
1056 (83.5) |
0 |
(0.0) |
209 (16.5) |
0 |
(0.0) |
0 |
(0.0) |
|
Others(Specify) |
11 |
(0.9) |
440 (34.8) |
451 (35.7) |
286 (22.6) |
77 (6.1) |
|||
STATEMENT |
SA |
A |
N |
D |
SD |
Increased urbanization with the development of urban |
402 |
438 |
83 |
125 |
217 |
Water channels poor drainage capacity arising from facility blockage by waste and debris. |
502 |
513 |
56 |
114 |
123 |
Development along drainage facilities/ flood drains. |
364 |
564 |
102 |
157 |
78 |
Carrying out fast paced deforestation increases flood vulnerability. |
562 |
463 |
26 |
108 |
106 |
Dumping waste and debris indiscriminately along natural drainage channels. |
250 |
617 |
124 |
127 |
147 |
Failure to heed to flood warnings. |
149 |
649 |
149 |
197 |
121 |
Do you get assistance from the government/ other |
|
|
Yes |
352 |
27.8 |
No |
913 |
72.2 |
Total |
1263 |
100 |
Type of assistance received during floods |
|
|
Building materials |
105 |
8.3 |
Food items |
601 |
47.5 |
Clothes |
115 |
9.1 |
Financial grant |
170 |
13.4 |
Soft loans |
10 |
0.8 |
Mattresses |
24 |
1.9 |
Utensils |
76 |
6.0 |
Children School materials |
164 |
13.0 |
Total |
1265 |
100.0 |
What is your assessment of government response |
|
|
Belated |
583 |
46.1 |
Immediate |
187 |
14.8 |
Inadequate |
319 |
25.2 |
Adequate |
132 |
10.4 |
Others |
44 |
3.5 |
Total |
1265 |
100.0 |
Is your household able to evacuate in case of a flood? |
|
|
Yes |
726 |
57.4 |
No |
539 |
42.6 |
Total |
1265 |
100.0 |
Place evacuated to |
|
|
Neighbours or relatives in Non-flood area |
352 |
27.8 |
Public School Building |
473 |
37.4 |
IDP Camp |
253 |
20.0 |
Church building |
22 |
1.7 |
Rented accommodation |
77 |
6.1 |
Migrate to other areas less vulnerable |
44 |
3.5 |
Others |
44 |
3.5 |
Total |
1265 |
100 |
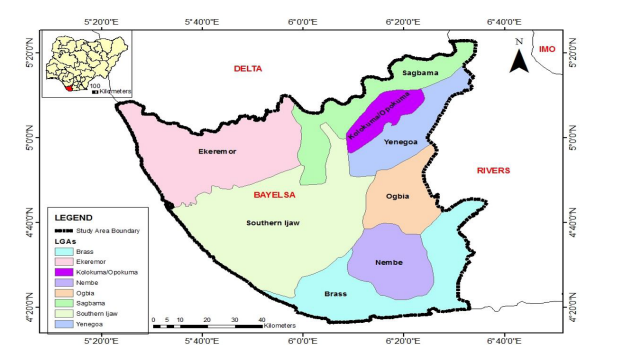 |
| Figure 1: Map of Bayelsa State showing the LGAs (Source: Bayelsa State Ministry of Lands and Survey, 2018) |
 |
| Figure 2: |
Introduction
Flooding is amongst the highly destructive, frequent and prevalent environmental hazards usually of different kind and magnitude [1]. Flood is a natural event that is unavoidable with frequent occurrence in waterways and natural drainage structures resulting in the destruction of lives, natural resources and environs together with health challenges and economic loss on yearly basis [2-6].
The emergence of flooding all over Nigeria takes the dimension of coastal, flash, river and urban. [7-8] Bayelsa State is situated in the core of the Niger Delta and in line with these reasoning, it is adjudged to be among the highly susceptible states to inundation in Nigeria. Annual Flooding resulting from coastline and riverine overflows appears to be afflicting a lot of locales in Bayelsa and the Niger Delta region of Nigeria long before the period of climatic changes cognizance. Recently, disasters due to flooding in Bayelsa State and most sections of Nigeria have led to so many deaths and property loss, in addition to endangered ecodiversity. According to Allen (2015) [5,22] the annual flooding experienced in Bayelsa State triggered by climate change causes loss of lives and fiscal assets as well as decreased attendance in schools with multiplier aftereffects on the educational system.
The floods in the year 2012 and the later one in 2018 encountered in the Niger Delta Region; inspired by global climate change had severe aftermath specifically on the area of education in Bayelsa State which led to the closure of schools for an interval of one month. The floods of 2012 is portrayed to be a flood disaster with the greatest degree of violence and destruction in the annals of Nigeria which leads to the displacement of 2.3 million humans, the killing of over 363 persons and damaging of approximately 597,476 buildings [9] The 2012 historical floods as advanced by [10] was triggered by many factors like: Abnormal rains linked with excessive climate conditions triggered by climatic changes and global warming, inappropriate land use and development along natural water channels, clogging of drainages and street channels and the discharge of excess water from Shiroro, Jebba and Kainji Dams on the Niger river and Ladgo Dam in Cameroun.
Nevertheless, the famous 2012 floods in Nigeria is perceived to have its origin from the inundation of Rivers Benue, Niger and their tributaries. These tributaries spring partially from selected runoffs generated at the far end of the foothills of Futa Jalon Mountains situated within the Republic of Guinea; and finally settles in the delta plains of the Deltaic region. The Niger-Benue river scheme also releases its contents through the main coastline floodplains of the Deltaic region into the Atlantic Ocean.
In accordance with [11] adverse impacts of the 2012 historic floods are more severe than the pollution of the Niger Delta in the past six decades by the action of oil companies. The reasoning is based on the fact that the whole effluent discharged, the acidified waters, the waste pits etc are all eroded into the various water bodies. Since many tributaries of the Niger-Benue River scheme uses Bayelsa State as the pathway for discharging their water into the Atlantic; the state displayed extremely elevated vulnerability index to flood hazards originating from these river scheme and from sea level rise motivated by climatic changes [12] In relation to sustainability, vulnerability can be referred to the degree of or the motive behind a community's susceptibility to disruption that might compromise the continuous existence of the community. In such manner, vulnerability is linked to resiliency- the extent to which a community could withstand and likely bounce back from a disruption, like floods [7].
However, [13] defined resilience as '' the ability of a populace, household, community, country, or a system to assimilate, adjust to, as well bounce back from distress in a way that reduces prolonged vulnerability, equally enable widespread growth.'' These could be attained through the implementation of adaption and mitigation strategies planned to assist the victims achieve sustainability to hazards [14-15] in a recently reviewed literature on resilience, described Community resilience as the ability or the process of a community to acclimatize and operate at the instance of disturbance. [16] described Community resilience as the capability of systems, societies, or communities vulnerable to risks to withstand, incorporate, adjust and bounce back from the impacts of such risk at the appropriate time and efficiently through the protection cum reestablishment of its vital structures and functions. Therefore, Community resilience is seen as an amorphous notion that was implied and used diversely by diverse groups.
This study, therefore is aimed at identifying anthropogenic activities that may lead to Community vulnerability to floods in the State; assess factors that influence community resilience to floods in Bayelsa State, Nigeria as well examine the extent at which community resilience can be achieved through the integration of traditional (structural) as well as conventional (Non-structural) methods.
The study shall assist in building Community Resilience Framework in Bayelsa State that will assist in reducing flood vulnerability aimed at making communities safer and more resilient to disasters. More importantly, this study helps in ascertaining the influence of flood resilience measures on sustainability of future generations as well as determine the effect of flood on social, economic and ecosystem variables as well as the manner in which communities' were coping with the flood.
Description of the Study AreaThe study area was the entire Bayelsa State, Nigeria, located in the Central Niger Delta and situated between the Niger and the lower Niger floodplain of the Niger Delta Region. It falls within the geographical location of latitude 4o 20’N and 5o 20’N and longitudes 5o 20’E and 6o 40’E (Figure 1). The state shares boundary with Delta on the North, Rivers on the East and is bounded on the West and South by the Atlantic Ocean. It has a population of about 1.7 million people based on the Nigerian 2006 census (National Population Commission, 2006). [21].
The study area has a tropical climate with two distinct seasons, wet (April-October) and dry (November-March). It also experiences two distinctive prevailing winds. These are the dry and dusty laden tropical continental air mass and the moist tropical maritime air mass. The tropical continental air mass is otherwise known as Harmattan wind [17]. It is a dry cold wind, embedded in the North-East trade wind that blows over the area from December to February (dry season). [18] posited that the mean annual rainfall ranges from 2,000 to 4,000mm and spreads over 8 to 10months of the year between the months of March and November, this coincides with the wet season. Bayelsa State is located within the lower delta plain believed to have been formed during the Holocene of the Quaternary period by the accumulation of sedimentary deposits. The major soil types in the state are young, shallow, poorly drained soils and acid sulphate soils. [19] posited that the major soil types of the study area are light to dark grey; fine sand to silty clay. Like any other area in the Niger Delta, the vegetation in Bayelsa State is composed of mangrove forests, freshwater swamp and lowland rain forest.Commercial timber species are also found in the area [20] The main occupations include farming and fishing.
This study employed the use of Landuse map of Bayelsa State acquired from the Landsat Imagery of 30m x 30m and the drainage network, road network, and community’s location extracted from the topographic map of 1: 100,000 scale of the study area; and soil map derived from the FAO website. The secondary data included the population data of 2006 of the communities from Bayelsa State obtained from National Population Commission [21]. Topographic map was obtained from Surveyor General’s office, Ministry of Lands and Survey, Bayelsa State [23].
Methods of Study
Sampling Techniques and Sampling FrameThe stratified with random sampling techniques were employed to carefully choose the sample size from the entire population of area under study. The study used household population of chosen communities. In the chosen communities, the various houses were labeled with even and odd numbers.
The houses labeled with odd numbers were chosen and questionnaires were administered on the heads of selected households. In households were the head is not available, the opportunity of completing the questionnaire was given to next individual in the hierarchy. However, stratified with random sampling remain the techniques employed to choose communities from each Local Government Areas (LGAs) in the State. [24] All the communities in the State were stratified into two groups according to their LGAs; namely communities that often experience flooding and the ones that hardly witness flooding. From the group that often experience flooding, not less than 5 communities were chosen randomly from each LGA, given a total of 41 chosen communities to carry out the survey (Table 1)..
Also, stratified sampling technique was again adopted to choose the sampled houses in each community. This was achieved by initially listing and numbering the houses and thereafter the houses labeled in odd numbers were taken and regarded as the sampled houses. The number of households in every sampled house was then counted and random sampling was utilized to choose the total sampled population used for questionnaire administration (Table 2). The entire state questionnaire administration follows a random sampling technique that selected 1505 respondents, whereas a total of 1265 (84.1%) copies of finished questionnaires were recovered for furtherance of the analysis.
Validity and Reliability of InstrumentResearch instruments are usually faced with the burden of validity and reliability. Research instruments are the means or tools employed for collecting data which includes; questionnaires, interviews as well as published materials. These however, can be confronted with the problems of validity and/or reliability as earlier observed. The research was subjected to content validity; however, the research instrument (questionnaires) were subjected for validation of its content. Reliability is the consistency in achieving similar results when the same method is applied to other similar situations. It therefore, involves reproducible techniques and their dependability all the time. The reliability of the study was determined by adopting the TestRetest method whereby reliability of instrument was made to undergo a pre-test analysis that utilized 10% from the totality of questionnaires to be distributed (that is 150 copies from the total of 1505 copies). That is, 10% of the copies of the instrument was directed to a smaller proportion of respondents and the findings was subjected to the Cronbach alpha test to acquire a reliability test score (measured between 0 and 1, with values tending towards 1 as being reliable) for a content validity of the instrument to be utilized. The outcome for this study was 0.72 (72%) content validity.
Results and Discussion
Factors influencing the extent of community resilience to flooding in Bayelsa StateTable 3 unveils the analytical results of factors affecting the extent of community resilience to flooding in the State. It indicated that 78.2% of responses accepted existence of social networks like electricity, water and telephone as a vital factor in building resilience of communities, 82.7% admitted that support of relatives, neighbors as well as friends contributed to community resilience, whereas 76.6% of the responses indicate housing units, shelters, business/industries and critical infrastructures' geographical location influences resilience of communities.
Also over 70% of responses agreed that physical infrastructure, transport facilities and communication accessibility are factors essential for building community resilience. However, other factors like awareness/information acquired from prior experiences with floods shared with relatives, neighbors, and friends, Livelihoods pattern, education level and NonGovernmental Organizations (NGOs) availability could possibly influence the resilience of communities to flood hazards in the State.
Community Flood Resilience MeasuresCommunity resilience measures involves the engagement and participation at community and householder level. Specific actions are needed to possibly carry out resistance and resilience building measures. And ownership of such responsibility will certainly become a key element of effective resilience raising, which usually lies on the house holder and/or community group. Resilience measures which includes adaptation, reduction and mitigation plans which could be linked with flood risk management measures are classified as traditional (structural) and conventional (Non-structural) measures.
Traditional (Structural) Measures:These are important with physical protection from hazards. It involves building of physical structures to avoid flooding of the entire house or a portion of it. Structural measures place emphasis specifically on utilizing local technology and expertise. In these measures, no real planning goes into their implementation. The structural measures involve the basic principles of storing, diverting and confinement of floods.
It consists of building infrastructure such as levees and dams or river dike that altars the river flow. Appropriate traditional measures of flood resilience embraced in localities include:
- Construction of sandbag/earth dikes
- Coastal embankment to protect roads
- Opening and protection of blocked drainage systems and channels
- Channelization/drainage building
- Land reclamation and structural stabilization
- Afforestation
- Elevation of buildings floor beyond the level of water
- Lay floor guards on Door steeps
- Construct trenches in gardens to redirect floodwater
- Evacuation of belongings from Ground floor
- Relocation (IDP camps, safer grounds, neighbor’s/friends’ houses, relative places, etc.)
The Non-structural measures can be perceived as a collection of mitigation and/or adaptation measures that do not apply traditional (structural) flood defenses. They include various mitigation measures which in no way alter the river inflow and these may include the responses of individual’s behaviour to the threat of flood. And these measures reduce damage without influencing the current of the flood incident. The non-structural measures aim to preserve individuals and their property away from floods. These measures comprise all flood management measures not at all dependent on large scale defenses:
- Programmes that raises awareness and orientation in communities (e.g. forecasting cum flood warning signals)
- Local preparedness plan development
- Establishment of Community Flood Management committees for implementation of local strategies
- Provision of a flood forecast-warning signal that is efficient
- Floodplain regulations (that includes landuse planning strategies)
- Flood risk assessment systems
- Economic instruments (including flood insurance)
- Maintaining community drainage systems in existence as well as building extra small scaled ones
- Building codes and zoning
- Flood proofing
- Health and social measures, etc. These measures appear today as indispensable compliments of structural engineering solutions.
In actual fact, our country Nigeria especially the Niger Delta Region focus on challenges of floods which threatens socioeconomic and environmental systems globally, however government have to work towards increasing resilience and also lower vulnerability to flood impacts.
Integration of traditional (structural) and conventional (non-structural) methodsThe analysis of Bayelsa traditional and conventional methods implemented to manage flood are shown in Table 4. Above 70% of the responses confirmed that the various traditional methods applied includes sandbag dyke’s construction, clogged drains and channels opening/maintenance, channel/drainage building, land reclamation, elevation of buildings floor beyond the level of water, resettlement as well as elevation of belongings from ground floor. Similarly, above 70% of responses also admitted that orientation along with awareness raising programmes (like flood warning signals), as well as development of local preparedness scheme were the structural methods embraced by the communities.
Table 5 displayed the degree of resilience both methods achieved. From the results 22.7% agreed the degree was high whereas 64% affirmed it to be low. Table 6 showed the influence of flood resilience measures on sustainability of future generations. The analysis indicated that above 70% of the responses admitted that accessibility of flood management committees, programmes that raise community awareness/orientation, hazard/vulnerability assessment reports, as well as local preparedness plan development are likely resilience measures which can influence sustainability of generations to come.
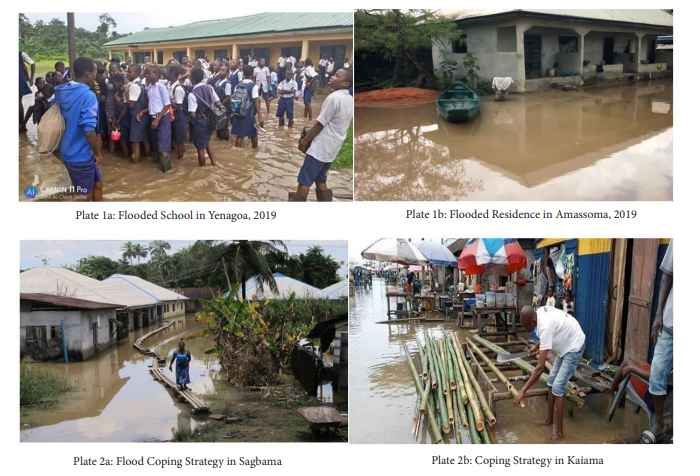
Effect of floods on social, economic, and ecosystem variablesThe effect of floods on social, economic and ecosystem variables are displayed in Table 7, 8 and 9, respectively. The outcome unveiled that 59.2% agreed that social life of residents was impacted by flood while 55.6% agreed they experienced damage to health facilities resulting to health effects during the floods. Concerning the health issues, above 70% of respondents believed that flood resulted in getting people sick of malaria fever, cough with skin diseases like measles and 88.7% complained that flood affected communities were isolated from public amenities like health centres, youth clubs, and community play grounds. More so above 70% of respondents agreed that schools were locked down for three weeks and four weeks owing to floods (Plate 1a & 1b)
The flood impact on economy presented in Table 8 reveals that 32.1% of the responses confirmed that their houses were damaged during the flood while 39.2% admitted that their houses were slightly damaged. Relating to issues on damaging of belongings, 31.3% claimed that their belongings were damaged totally, 40% said slightly damaged while 27.8% said no damage of belongings was experienced. Among the lost belongings itemized in the study area, the respondents disclosed that more than 40% agreed that they lost furniture and other items of great value. Furthermore, 65.3% agreed that lives were lost during the flood and over 60% attested that floods resulted to loss of daily wage, disruption of water and electricity, and disruption of transport and communication modes.
Table 9 presents flood effects on ecosystem activities. It disclosed that over 50% of respondents reacted that flooding lead to loss of livestock and habitat, households experienced farms and crop damage during floods, dispersal of weed species and invasive species, silting of ponds and lakes, including river bank and soil erosion.
Residents Coping Strategy to FloodsTable 10 indicates some of the coping strategies adopted when flooding occurs in Bayelsa State. Consequently, above 60% of the responses consented that canals building, evacuation to higher/ safer places, construct trenches in gardens/farms to redirect flood water, together with evacuation of properties from house were the leading strategies adopted to cope with the occurrence of floods in the State (Plate 2a & 2b).
Identification of anthropogenic activities that may possibly enhance community vulnerability to flood in Bayelsa StateTable 11 depicts the anthropogenic activities that may possibly enhance community vulnerability to flood in the State. The table disclosed that 66.4% of the respondents admitted increased urbanization with development of urban structures in the vicinity of river channels as an anthropogenic activity, 80.3% admitted water channels poor drainage capacity arising from facility blockage by waste and debris, 73.4% admitted developments along drainage facilities/flood drains whereas 81% admitted carrying out fast paced deforestation. Also 68.3% admitted that dumping waste and debris indiscriminately along natural drainage channels amplifies vulnerability to floods
Relief AssistanceTable 12 portrays the analysis of relief assistance donated to flood victims and their evacuation styles. The results disclosed that 72.2% of the responses claimed not receiving any assistance from government or other institutions in the course of floods or thereafter whereas 27.8% confirmed receiving assistance.
Taking into consideration the type of assistance given to the victims of the flood hazard, a greater part of the respondents (47.5%} accepted that they were provided with food items most of the time, whereas 13.4% and 13% confirm receiving financial grants and children school materials respectively. Regarding government's timely response and value of items provided throughout and after the floods, 46% of respondents
admitted that it is always belated whereas 25.2% confirmed that it is inadequate most of the time. Also 57.4% of the responses confirmed that they were able to evacuate their households on the occasion of floods; and 37.4% attested to the fact that flood victims were evacuated to public school buildings, 20% admitted being evacuated to IDP Camps whereas 3.5% admitted that they migrated to other less vulnerable areas.
Conclusion
The study findings disclosed that 2020.40 km2 (12.9%) of Bayelsa State exhibited low vulnerability to floods. Moderate vulnerability and high vulnerability areas spread over a spatial extent of 9342.04 km2 (59.8%) and 4248.95 km2 (27.3%) respectively. Thus, a greater part of Bayelsa State covering 87.1% of the area recorded moderate with high vulnerability echelons, also perceived as areas prone to floods using the factors under consideration. Furthermore, approximately 43 (11.05%) communities consisting of Akassa, Agberi, Agbalamabugokiri, Bolougbene, Bwama, Egwema, Odioma, Sangana, Tomkiri, Twon, Zarama are among those that fall within low flood vulnerability echelons. The communities with moderate vulnerability feature were about 287 (73.78%) comprising Abagbene, Adagbabiri, Amassoma, Brass-town, Botokiri, Ekeremor, Fangbe, Kaiama, Korama, Nembe, Ogboinbiri, Opolo, Sagbama, Tombia as well as Uruama. However, 59 (15.17%) communities in the State show high vulnerability to flood. Some of the communities are Abolikiri, Agbura, Amakalakala, Biogbolo, Ekeki, Fantua, Imiringi, Okpokiri, Okpoma, Otueke, Oweikorogha, Peremabiri, Polaku, Swali and Yenagoa.
This research unveiled that 27.8% of the respondents fall within the ages of 20 - 30 years, 23.5 % are 31 - 40 years, 26.1% are 41 - 50 years while 17.4% are 51 - 60 years. Analysis of responses to marital status shows single (22.6%), married (63%), divorced (0.9%), separated (3.5%) while widowed (5.2%) and common relationship (3.5%). The results also showed that 0.9% had primary education, 13.9% had secondary education, 33% had lower tertiary education and 50.4% had university education whereas 1.7% did not have formal education. Above 80.0% of the responses on household size fall within the range of 1 - 10. The responses on religion settings in the State indicated that 95.7% were Christians, whereas 4.3% were into Islamic religion practice. Also 59.1% of responses confirmed that the location of communities under study were in areas prone to floods or near a river. Going further, 33% of responses confirm staying in coastal areas whereas 7.8% affirmed that they are resident in urban areas with huge artificial impervious surfaces. Consequently, 92.2% of the responses indicated having bitter experience concerning environmental hazards in the preceding five years and flooding was perceived to be among the major hazards.
The 2018 flood was perceived to be high in height as over 80% of responses in different occasions consented that the flood height was over feet, equivalent to ankle, knee and over knee. Moreover, 40.9% of respondents admitted their reason for continuous stay in flood prone areas is job proximity, 16.5% agreed on close to relatives and 13.9% to sustain and secure home grounds. The analysis further disclosed that 72.2% of the responses claimed that no assistance was gotten from government or related institutions in the course of floods or thereafter whereas only 27.8% affirmed receiving assistance.
Taking into account the items provided for flood victims, majority (47.5%) admitted that they were provided with food items at all times, 13.4% affirmed financial grant whereas 13% affirmed children school items. On the anthropogenic actions that heighten community vulnerability to flood, 66.4% accepted urbanization increase with an extension of urban structures near river channels whereas 80.3% affirmed water channels poor drainage capacity which arises from facility blockage by waste and debris. Over 70% of responses admitted that accessibility to physical infrastructure (i.e. bridges, roads, levees, dams e.t.c.) together with communication/transport facilities are indispensable factors for community resilience. Though, notable factors such as knowledge/information acquired from past flood experience shared with friends, neighbors and relatives, along with livelihood pattern substantially influence the resilience of communities to floods in Bayelsa.
On the issue of resilience actions embraced during flooding, above 70% of responses attested to using various traditional methods like sandbag dyke’s construction, channel and drainage building, clogged drains/channels opening/maintenance, reclaiming of land, elevation of building floor beyond the level of water, relocation in addition to evacuating belongings from ground floor. Similarly, above 70% of the responses attested to orientation/awareness raising programmes in communities (inclusive of flood warning signal), as well as establishment of local preparedness plan as the Non-structural measures they adopted. Findings further revealed that 32.1% of the responses admitted that their house was damaged during the flood while 39.2% attested to the fact houses belonging to them were slightly damaged. As regards to the damage on the belongings, 31.3% said that their belongings were damaged totally, 40% said slightly damaged while 27.8% admitted not having any experience on damage of belongings.
The study further established that flood really affected the socioeconomic and ecosystem activities of Bayelsa communities, in spite of that the role of government was rarely seen to support the flood victims. Furthermore, flood incident is seemingly a yearly recurring concern with lives and properties lost numerously in the State.
References
- Wizor CH, Week DA (2014) Impact of 2012 Nigeria on Emergent Cities of Nigeria: The Case of Yenagoa, Nigeria. Journal of Civil and Environmental Research 6: 31-34.
- Thilagavathi G, Tamilenthi S, Ramu C, Baskaran R (2011) Application of GIS in Flood Hazard Zonation Studies in Papanasam Taluk, Thanjavur District, Tamilnadu. Advances in Applied Science Research 2: 574-85
- Chiadikobi KC, Omoboriowo AO, Chiaghanam OI, Opatola AO, Oyebanji O (2011) Flood Risk Assessment of Port Harcourt, Rivers State, Nigeria. Advances in Applied Science Research 2: 287-98.
- Berezi OK, Eludoyin OS, Akpokodje EG, Obafemi AA (2015) Flood Vulnerability Prediction in Kolokuma/Opokuma LGA, Bayelsa State, Nigeria using Geographic Information System (GIS). The Nigerian Journal of Cartography and GIS 10: 86-102.
- Berezi, OK; Obafemi AA, Nwankwoala HO (2019a) Flood Vulnerability Assessment of Communities in the Flood Prone Areas of Bayelsa State, Nigeria. International Journal of Geology & Earth Sciences 5: 19-36
- Nwankwoala HO, Jibril T (2019a) Flood Height Measurement and Analysis in parts of Obio/Akpor Local Government Area, Port Harcourt, Nigeria, Engineering Management Research 8: 1-10
- Berezi OK, Obafemi AA, Nwankwoala HO (2019b) Public Perception of Communities towards Flood Vulnerability and Resilience in Bayelsa State, Nigeria. International Journal of Ecology & Environmental Sciences, 1: 08-20
- Nwankwoala HO, Jibril T (2019b) Flood Sensitivity Analysis and Impact Assessment in parts of Obio/Akpor Local Government Area, Rivers State. World Applied Sciences Journal 37: 716-41
- Wills I (2014) Bayelsa State 5th Environment Outreach Lecture and Environmental Awards. (http://www. worldstagegroup.com/worldstagenew/index.php/index. php?active=news&newscid=17641&catid=44)
- Akpokodje EG (2012). The overview of causes, impacts and lessons learnt from the 2012 flood Disaster in Nigeria. Presentation made at the first Niger Delta Environment and Sustainable Development Conference and Symposium on the floods of 2012 in Nigeria. Held from 14th -16th November, 2012 at the University of Port Harcourt, Choba, Rivers State, Nigeria.
- Fubara D (2012). Avoiding the 2012 Flood Experience. (www.thetidenewsonline.com)
- Lawal O, Umeuduji JE (2017) Exploration of hydrogeomorphological indices for coastal floodplain characterization in Rivers State, Nigeria. Ghana Journal of Geography 9: 67-87
- USAID (2012) Building Resilience to Recurrent Crisis. USAID Policy and Program Guidance. https:// www.usaid.gov/sites/default/files/documents/1870/ USAIDResiliencePolicyGuidanceDocument.pdf
- Mmom PC, Ayakpo A (2014) Spatial analysis of flood vulnerability levels in Sagbama Local Government Area using geographic information systems (GIS). International Journal of Research & Environ. Studies 4: 1-8.
- Castleden M, McKee M, Murray V, Leonard G (2011) Resilience thinking in health protection. Journal of public health, Oxford England. PubMed PMID 33: 369-77.
- Ostadtaghizadeh A, Ardalan A, Paton D, Jabbari H, Khankeh H (2015) Community disaster resilience: A systematic review on assessment models and tools. PLOS Current Disasters 12: 23-35.
- Osuiwu BO. Ologunorisa TE (1999) “Weather and Climate”, In Oyegun, C.U & Adeyemo, A (Ed): Port Harcourt Region, Paragraphics Port Harcourt, Nigeria
- Alagoa EJ (2013) The Land and People of Bayelsa State: Central Niger Delta. Onyoma Research Publications, Port Harcourt 9-57.
- Youdeowei PO, Nwankwoala HO (2011) Studies on subsoil characteristics of sand deposits in some parts of Bayelsa State, Eastern Niger Delta, Nigeria. Journal of Soil Science and Environmental Management 2: 34-8.
- Akpokodje EG (1987) The Engineering-Geological characteristics and classification of the major superficial soils of the Niger Delta. Engineering Geol 23: 193-211.
- National Population Commission (NPC) (2006). 2006 Housing and population census result: Bayelsa State National population Office, Yenagoa. 2006.
- Allen JRL (1965) Coastal geomorphology of eastern Nigeria beach ridges barrier islands and vegetated tidal flats. Geology Mijabonw 44: 1-21.
- Bayelsa State Ministry of Lands and Survey (2018). Map of Bayelsa State.
- Hyogo Framework for Future (2005). Hyogo Framework for Action (2005-2015), Building the Resilience of Nations and Communities to Disasters, Report of the World Conference on Disaster Reduction 18-22 January 2005, Kobe, Hyogo, Japan (www.unisdr.org/wcdr)
Article Information
Review Article
Received Date: October 05, 2022
Accepted Date: November 05, 2022
Published Date: November 09, 2022
Influence of Community Resilience to Flood Risk and Coping Strategies in Bayelsa State, Southern Nigeria
Volume 2 | Issue 1
Citation
Berezi O.K, Nwankwoala H.O (2022) Influence of Community Resilience to Flood Risk and Coping Strategies in Bayelsa State, Southern Nigeria J Environ Sci Energy 2: 1-19
Copyright
©2022 Nwankwoala. This is an open-access article distributed under the terms of the Creative Commons Attribution License, which permits unrestricted use, distribution, and reproduction in any medium, provided the original author and source are credited.

doi: jese.2022.2.103