

Review Article
Volume-1 Issue-1, 2021
Occupational Exposure Assessment of Organic Pollutants Emitted Through Aerosols from Recycling of e-Waste
Received Date: April 29, 2023
Accepted Date: May 29, 2023
Published Date: May 31, 2023
Journal Information
Abstract
The emission of airborne particulate matter is produced by the industrial processes of metal extraction from electronic waste (e-waste). These aerosols can transport organic contaminants, such as polyaromatic hydrocarbons and polybrominated biphenyls. These pollutants are proven to have long-term effects on workers' health. In this work, we characterize aerosol particles and dust deposited from a recycling process of printed circuit boards and waste cables in a recycling plant. A Scanning Mobility Particles Counter and Sizer (SMPCS) was used to measure the size distributions of ultrafine particles. A Micro-Orifice Uniform Deposition Impactor (MOUDI) collected aerosol particle samples for chemical analysis. All plant compartments checked are subject to high particulate matter concentrations during work hours. Concentrations of organic pollutants in the aerosols do not pose a short, or long-term health risk. However, the accumulation of aerosols in other compartments in the form of dust may present an indirect danger to workers’ health.
Key words
WEEE; Recycling; aerosol; PBDEs; PAHs; Exposure
Age Group (Years) |
Average Air Breathen (m3/8h shift) |
||||||||||
Mean |
5th |
10th |
25th |
50th |
75th |
90th |
Maximum |
|
|||
21 |
to |
31 |
14 |
9.5 |
10.1 |
11.6 |
13.4 |
15.8 |
18.6 |
34.4 |
MALES |
31 |
to |
41 |
14.5 |
10.3 |
10.9 |
12 |
14 |
16.4 |
19 |
27.7 |
|
41 |
to |
51 |
15.2 |
10.8 |
11.7 |
13.1 |
14.6 |
16.8 |
19.3 |
30.4 |
|
51 |
to |
61 |
15.7 |
10.8 |
11.5 |
13.4 |
15.1 |
17.8 |
20 |
33.8 |
|
61 |
to |
71 |
14.3 |
10.8 |
11.5 |
12.5 |
14 |
15.5 |
17.7 |
25.1 |
|
21 |
to |
31 |
11 |
7.5 |
8 |
9.1 |
10.5 |
12.5 |
14.4 |
26 |
FEMALES |
31 |
to |
41 |
10.96 |
8.1 |
8.4 |
9.4 |
10.6 |
11.9 |
13.9 |
22.7 |
|
41 |
to |
51 |
11.8 |
8.4 |
9.1 |
10 |
11.5 |
13.2 |
14.8 |
24.3 |
|
51 |
to |
61 |
12.1 |
9 |
9.5 |
10.5 |
11.7 |
13.5 |
15.3 |
22.2 |
|
61 |
to |
71 |
10.3 |
8.1 |
8.5 |
9.2 |
10 |
11.1 |
12.3 |
17 |
|
|
MLA PCBS and cables Recycling Area |
MLB Workshop and Dismantling |
MLC Blind Spot Recycling Area |
|||
Nanoparticle Size |
PM1 |
PM10 |
PM1 |
PM10 |
PM1 |
PM10 |
Intake (ng/Sh shift) |
||||||
Fluorene |
4.6E-01 |
4.6E-01 |
2.9E-01 |
1.8E+OO |
1.5E+OO |
3.0E-01 |
Phenanthrene |
2.2E+OO |
1.9E+OO |
2.0E+OO |
2.6E+OO |
2.2E+OO |
1.3E+OO |
Anthracene |
1.7E-01 |
2.2E-01 |
1.1E-01 |
1.8E-01 |
1.5E-01 |
1.4E-01 |
C1-Phe |
2.7E-01 |
2.4E-01 |
2.0E-01 |
3.0E-01 |
2.5E-01 |
1.6E-01 |
C2-Phe |
3.7E-01 |
3.2E-01 |
2.4E-01 |
3.9E-01 |
3.2E-01 |
2.3E-01 |
C3-Phe |
5.2E-01 |
3.4E-01 |
2.9E-01 |
4.7E-01 |
3.9E-01 |
5.5E-01 |
C4-Phe |
2.4E-01 |
1.8E-01 |
2.0E-01 |
2.5E-01 |
2.0E-01 |
1.3E-01 |
3.6 DMP |
1.0E-01 |
6.2E-02 |
4.4 E-02 |
5.2E-02 |
4.4 E-02 |
2.4E-01 |
2.6 DMP |
5.6E-02 |
4.9E-02 |
2.0E-02 |
5.1E-02 |
4.4 E-02 |
3.2E-02 |
2.7 DMP |
6.8E-02 |
7.2E-02 |
3.9E-02 |
5.7E-02 |
4.9E-02 |
4.0E-02 |
1.3/2.10/3.9/3.10 DMP |
4.0E-02 |
4.3E-02 |
9.8E-03 |
3.7E-02 |
3.2E-02 |
3.4E-02 |
1.6/2.9 DMP |
1.7E-01 |
1.6E-01 |
7.5E-02 |
1.4E-01 |
1.2E-01 |
9.1E-02 |
Fluoranthene |
7.2E-01 |
4.7E-01 |
2.6E-01 |
4.2E-01 |
3.5E-01 |
5.7E-01 |
1.7 DMP |
8.4E-02 |
7.1E-02 |
3.1E-02 |
7.2E-02 |
6.1E-02 |
5.0E-02 |
2.3 DMP |
1.1E-01 |
9.1E-02 |
1.1E-01 |
8.0E-02 |
6.8E-02 |
1.4E-01 |
1.9/4.9 DMP |
7.6E-02 |
6.9E-02 |
4.4 E-02 |
5.7E-02 |
4.9E-02 |
5.4E-02 |
1.8 DMP |
2.0E-02 |
2.9E-02 |
1.3E-02 |
1.4E-02 |
1.2E-02 |
1.4E-02 |
Pyrene |
1.7E+OO |
6.2E-01 |
2.2E-01 |
5.6E-01 |
4.7E-01 |
9.2E-01 |
C1-202 |
3.6E-02 |
4.8E-02 |
4.1E-03 |
1.7E-02 |
1.4E-02 |
5.0E-02 |
C1-202 |
3.7E-02 |
5.5E-02 |
6.3E-03 |
2.1E-02 |
1.8E-02 |
5.6E-02 |
C1-202 |
2.8E-02 |
3.9E-02 |
3.9E-03 |
1.6E-02 |
1.4E-02 |
4.2E-02 |
Ret |
O.OE+OO |
O.OE+OO |
O.OE+OO |
O.OE+OO |
O.OE+OO |
O.OE+OO |
4H-Cy |
1.4E-01 |
9.0E-02 |
1.8E-02 |
1.1E-01 |
9.0E-02 |
2.7E-01 |
Benzo(a) anthracene |
5.5E-02 |
2.5E-01 |
2.7E-02 |
4.0E-02 |
3.4E-02 |
2.1E-01 |
Chrysene |
1.8E-01 |
4.6E-01 |
6.0E-02 |
1.3E-01 |
1.1E-01 |
3.8E-01 |
C1-Crysene |
3.3E-02 |
1.2E-01 |
O.OE+OO |
1.5E-02 |
1.2E-02 |
4.9E-02 |
Benzo(b)fluoranthene |
1.9E-01 |
4.7E-01 |
6.5E-02 |
2.5E-01 |
2.1E-01 |
1.1E+OO |
Benzo(k)fluoranthene |
6.5E-02 |
2.7E-01 |
5.0E-02 |
1.1E-01 |
8.9E-02 |
3.7E-01 |
Benzo(bjk)fluoranthene |
7.2E-03 |
5.1E-02 |
7.9E-03 |
9.7E-03 |
8.0E-03 |
1.2E-01 |
Benzo(e)pyrene |
1.5E-01 |
4.1E-01 |
4.0E-02 |
1.9E-01 |
1.6E-01 |
7.6E-01 |
Benzo(a)pyrene |
9.5E-02 |
2.8E-01 |
2.9E-02 |
1.1E-01 |
9.1E-02 |
5.9E-01 |
Perylene |
3.6E-02 |
4.0E-02 |
4.3E-03 |
2.7E-02 |
2.2E-02 |
9.1E-02 |
Anthranene |
3.2E-02 |
1.0E-01 |
3.2E-02 |
5.5E-02 |
4.5E-02 |
2.9E-01 |
lndeno(123cd)pyrene |
1.2E-01 |
3.2E-01 |
7.9E-02 |
1.8E-01 |
1.5E-01 |
1.0E+OO |
Dibenzo(ah)anthracene |
4.4 E-02 |
8.0E-02 |
O.OE+OO |
2.3E-02 |
1.9E-02 |
8.5E-02 |
Benzo(ghi)perylene |
1.3E-01 |
4.9E-01 |
6.2E-02 |
2.8E-01 |
2.3E-01 |
1.3E+OO |
Coronene |
O.OE+OO |
O.OE+OO |
O.OE+OO |
O.OE+OO |
O.OE+OO |
O.OE+OO |
Sum |
8.8 |
9 |
4.7 |
9.1 |
7.6 |
11.9 |
|
MLA PCBS and cables |
MLB Workshop and Dismantling |
MLC Blind Spot Recycling Area |
|||
Nanoparticle Size |
PM1 |
PM10 |
PM1 |
PM10 |
PM1 |
PM10 |
Substance |
ng/sh Shift |
|||||
PBDE_ 15 |
0 |
0 |
0 |
0 |
0 |
0 |
PBDE_28 |
44 .5 |
11.9 |
0 |
0 |
0 |
0 |
PBDE_47 |
1151.7 |
1146.9 |
1094.6 |
1780.2 |
438 |
1247.7 |
PBDE_99 |
1141.4 |
1528.9 |
1589.9 |
2013.3 |
468.7 |
1140.8 |
PBDE_ 100 |
150.1 |
145.5 |
142.3 |
247.7 |
54.4 |
140.6 |
PBDE_ 153 |
192.2 |
264.1 |
215.2 |
363.9 |
49.2 |
207.3 |
PBDE_ 154 |
108.1 |
129.8 |
121.1 |
178.8 |
49.2 |
101.5 |
PBDE_ 183 |
36.6 |
197.1 |
131.4 |
344 .9 |
0 |
383 |
Sum |
2824.6 |
3424.2 |
3294.5 |
4928.8 |
1059.5 |
3220.9 |
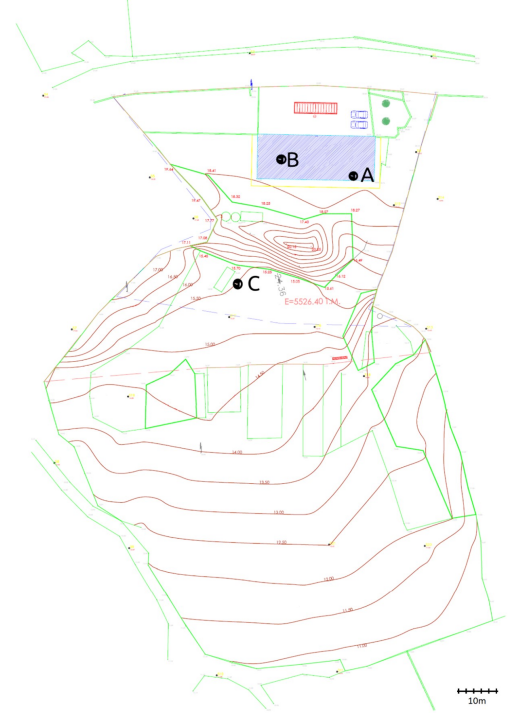 |
| Figure 1: Schematic diagram of the site and the particulate matter measurement locations at (A-MLA) the printed circuit boards and cables processing territory, (B-MLB) the workshop and large appliances dismantling line, and (C-MLC) remote point outside the plant |
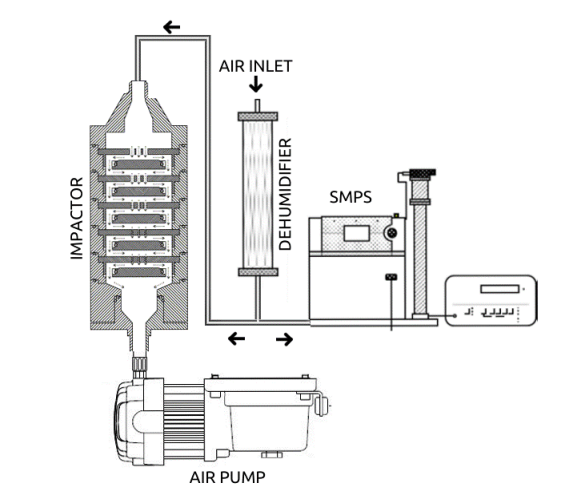 |
| Figure 2:The configuration of the cascade impactor and the scanning mobility particle sizer (SMPS) |
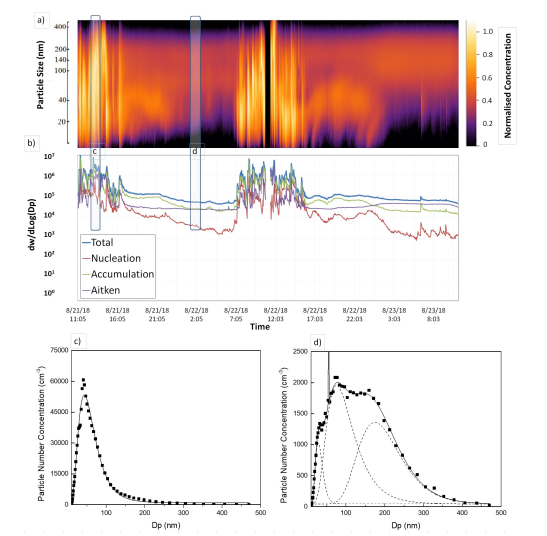 |
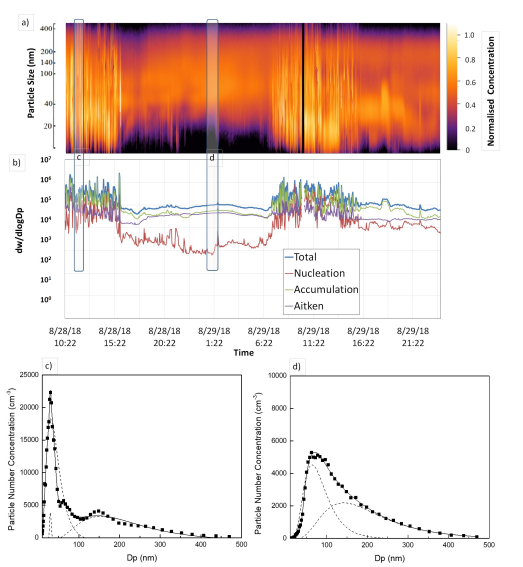
| Figure 3: Contour plots of SMPS measurements over the first and second day, at the circuit boards and cables processing territory (MLA), and b) Total, nucleation, accumulation, and Aitken aerosols. c, d) Charts of distribution of particles in two instances: First, during operation of the processing machines of PCBs (left, territory marked as “a” in the previous graph), and secondly and secondly during shutdown (right territory marked as “b” in the previous graph) |
 |
| Figure 4: Contour plots of SMPS measurements over the third and fourth day, at the workshop and dismantling territory (MLB), and b) Total, nucleation, accumulation, and Aitken aerosols. c, d) Charts of distribution of particles in two instances: First, during the operation of the processing machines of PCBs which is settled in the room next to the workshop (left, territory marked as “a” in the previous graph), and secondly and secondly during shutdown (right territory marked as “b” in the previous graph) |
 |
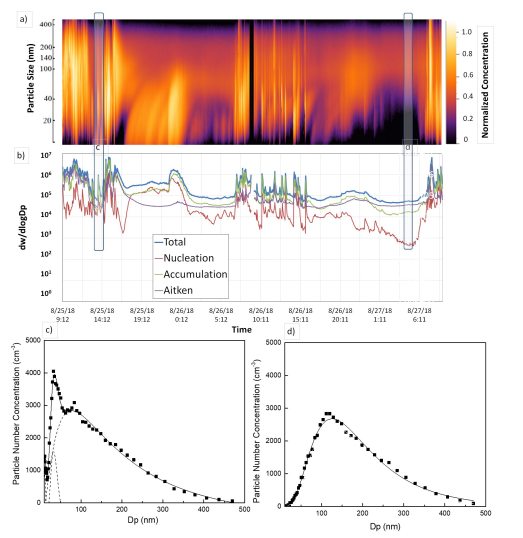
| Figure 5: a) Contour plots of SMPS measurements over the fifth and sixth day at the blind spot and b) Total, nucleation, accumulation, and Aitken aerosols. c,d) Charts of distribution of particles in two instances: First, during operation of the plant (left, territory marked as “a” in the previous graph), and secondly and secondly during shutdown (right territory marked as “b” in the previous graph) |
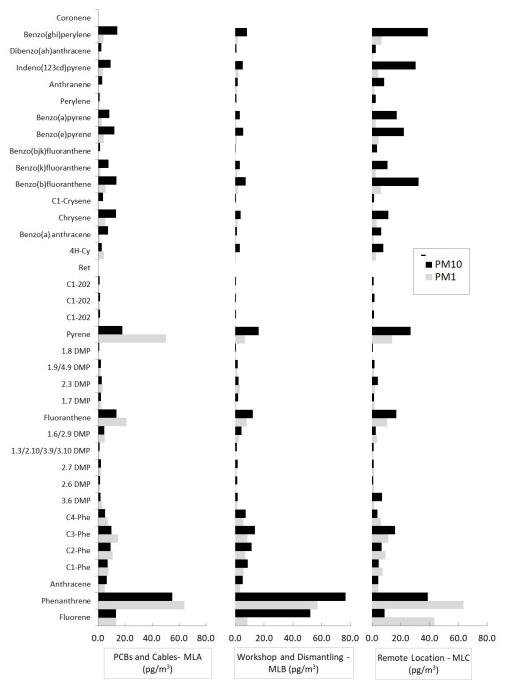 |
| Figure 6: PAH analysis of PM1 and PM10 filters of three days, one for each region |
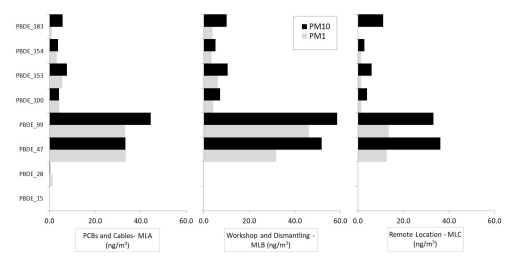 |
| Figure 7: PBDEs analysis of PM1 and PM10 filters of three days, one for each region |
Introduction
Electronic scrap also called e-waste or waste electrical and electronic equipment (WEEE) is an emerging part of municipal solid waste [1,2]. Recycling of WEEE bares the advantage of the high commercial value of the end products (metals) [3,4]. Toxic substances albeit in small amounts could become a serious concern to the environment and the personnel of a recycling plant [5].
In e-waste recycling, brominated flame retardants (BFRs), from Printed Circuit Boards (PCBs), are perhaps the most harmful organic compounds [6,7]. BFRs are the bromodioxin major contributors since they can produce halogenated (brominous) dioxins and furans. They are very often used in WEEE electronic circuits, sometimes up to 20 percent wt [8,9]. BFR use in 2000 was 32,000 tn in Europe and around 540,000 tn worldwide [10]. Some of the most common BFRs are Tetrabromobisphenol A (TBBP-A), Polybrominated Biphenyls (PBB), Polybrominated diphenyl ethers (PBDE), Hexabromocyclododecane (HBCD), Phenylethers and Brominated Bisphenol [11]. BFRs can generate brominated dioxins through chemical reduction at temperatures from 350 to 400°C. Bromodioxins can even be randomly produced [12,13] or even from decabromodiphenyl ether after exposure to UV rays [14]. The nature of the processes of WEEE recycling, such as milling, shredding, and grinding of PCBs and cables, as well as catalytic influences of certain substances (SbO, Fe2O3,) and also moisture, enhance the generation of bromodioxins [15-20]. Bromodioxins could be transported by particulate matter with dimensions ranging from several nm to tens of micrometers.
Aerosols themselves (i.e. particles having a size lower than 100 nanometres) are a very common health risk in industrial plants [21,22]. A growing amount of research proved that pulmonary and heart diseases are directly associated with aerosols themselves [23-26]. The association of processes between the human organism and aerosols has still not been properly understood [27]. Nevertheless, a significant amount of toxicological and epidemiological research indicated that smaller aerosols have more acute health consequences [28-30].
In this study, we document measurements of aerosols produced by printed circuit boards (PCBs) and waste cables milling in a small-scale recycling industry and measure BFRs and polyaromatic hydrocarbons (PAHs) in airborne particulate matter. An evaluation of an employee's inhalation absorption is also implemented to assess the employee's protection level from the particulate matter, and the organic contaminants carried with it.
Materials and Methods
Description of the Facility-Measurement locations
All analyses were carried out at a recycling facility that serves the needs of a population of 85,000. The firm's operations include plastics and paper packaging, e-waste, discarded copper wires, discarded metals, and waste automobiles. The factory is thus split between different sectors assigned to different recycling activities.
The factory’s building consists of two areas (Figure 1, top), segregated by a wall. There is no intermediate communication between the two areas, and thus, no direct internal influence between them. PCBs and waste cables recycling equipment is located in the eastern area of the ground level. The equipment includes machinery for shredding, grinding sieving, and separation with air cyclones, electric sieves, and vibrating tables. All these series of equipment comprise two individual systems of PCBs and cable recycling. Their function is to distinguish the metallic and non-metallic fractions of the cables and PCBs. This is the first location of examination and the contamination source (Figure 1, A, Measurement Location A, MLA). The non-metallic fraction of the PCBs is made of compressed cardboard, woven glass and epoxy resin, phenolic cotton paper, cotton paper, and epoxy resin, and matt and polyester glass [31].
The PCB’s non-metallic parts and the ground plastic insulation of the cables are guided by a common airflow outside the building and are collected in bags. The room west of the aforementioned territory is allocated to steel processing and welding odd jobs, repairs, and large household appliances manual dismantling (washing machines, refrigerators, cookers). This is the second location of examination (Figure 1, B, Measurement Location B, MLB).
The other area of examination (Figure 1 C, Measurement Location C, MLC) is a distant location outside the factory buildings, situated in the factory's southwest part. This area used to host a cathode ray tube processing area, however, during the time of measurements, the recycling line had been relocated to other parts of the plant. This location is situated behind a pile of scrap metals as seen in Figure 1. Thus, it remained to be determined whether it was possible for this location to be influenced by the indirect release of pollutants from the source of contamination, the PCBs and cables grinding and processing location.
Measurements of Airborne Particulate Matter
Α Grimm Model 5416 Scanning Mobility Particle Counter and Sizer (SMPCS) monitored the aerosol dimension distributions at the aforementioned factory areas. The SMPCS monitored the distribution of the mobility diameter the aerosols from dimensions of 5 to ca 1094 nm. The inlet flow rate of the SMCPS was 0.3L/min, and the measurement period was 3 min [32-34]. Aerosols that were greater than ca. 1094 nm were excluded from the air current circuit. The timeframe required to calculate the diameter distributions of aerosols with dimensions from 10 to ca 1094 nm in the measurements was 3 min. Aerosol Instrument Manager TSI version 6.0 monitored the raw data.
Additionally, a multi stage cascade impactor (Thermo Scientific 20-830-SS Marple and Cascade Impactor) was used, in order to capture aerosols for PBDEs chemical examination. The filters used were 0.47 cm high-purity quartz (SiO2) microfiber filters (Whatman Qm-A). The impactor collected aerosols using 2 chambers of impaction for aerosols with dimensions less than 1 μm (PM1) and less than 10 μm (PM10), is in accordance with the methodology proposed by Marple et al. [35]. The pump operated at approximately 24 m3 per day.
Particulate matter mass and number concentrations were measured by the cascade impactor and the SMPCS simultaneously, by sampling ambient air by a common inlet tube traversing a dehumidifier and divided into two streams for each instrument, as depicted above (Figure 2).
The inlet tube was a 60x8 cm tubular humidity-reducing configuration packed with a yellow bead from silica gel (Silikagel Trockenperlen, Azelis GmbH).
Over the warmer months of the year (end of August), aerosol data and samples were collected out for 6 days in the three aforementioned discrete locations around the recycling center facilities (as seen in. Figure 1).
Analysis of Polyaromatic Hydrocarbons (PAHs) and Polybrominated Diphenyl Ethers (PBDEs) in the Particle Samples Particulate Matter
Analysis of PBDEs and PAHs – Liquid-liquid extraction method
For PBDEs analysis, collected substances from the quartz filters of the impactor were extracted with dichloromethane: hexane (1:1) in an accelerated solvent extraction system. Prior to extraction, the quartz filters were spiked with a range of recovery standards for PBDEs.
The extract was rotary evaporated to 1 ml and treated with concentrated H2SO4 until no color was visible in the acidic phase. Then the organic layer was separated from H2SO4, evaporated to 0.5 mL, and transferred to a Pasteur pipette column packed with silica gel (SiO2) in the bottom (1 cm) and 40% sulphuric acid silica gel (40% H2SO4–SiO2) at the top (3cm). The sample was eluted with 8 mL of dichloromethane and the volume was reduced to 0.5 ml. The solvent was exchanged with hexane and the sample was applied to a Pasteur pipette column packed with silica gel activated at 300o C for 3 h. The column was eluted with hexane (first fraction) and dichloromethane in hexane (second fraction). Subsequently, the second fraction was rotary evaporated to 200 μL, transferred into a glass vial, and further evaporated to approximately 5 μL under a stream of N2. Finally, a BDE standard solution was added as an internal standard, to achieve a final volume of 25 μL.
For PAH analysis, substances from the filters (about 0.5 g from each) were Soxhlet extracted with toluene for 24 h and the extracts were evaporated to almost dryness. Quantities of half a microgram of polyaromatic hydrocarbons doped with D2 were added to each extract. N – C5H12 was used as the exchange agent for the solution and the optimized liquid–liquid technique took place. 5% dimethylformamide ((CH3)2NC(O)H solutions in ultra-pure water were used to part 2 ml of the n – C5H1 2 solution twice. Both (CH3)2NC(O)H partitions were added together in a beaker. Subsequently, they were transferred in glass tubes. A quantity of 4 ml of C6H6 solution was then used to retrograde extract the polyaromatics with the addition of another 4 ml of ultra- -pure H2O. In continuation, a repetition of the back extraction took place with another 4 ml of C6H6. The C6H6 quantity was then decreased. The chemical efficiency of the technique was higher than 80, and up to 100%.
Extracts of PAHs and PBDEs from particulate matter were analyzed by a gas chromatograph (Agilent 6890 Series, Agilent Technologies, Palo Alto, CA, USA), which consists of a cool on-column injector combined with a mass spectrometer (Agilent 6890 Series, Agilent Technologies, Palo Alto, CA, USA) based on selected ion monitoring using electron impact ionization (70 eV electron energy).
Analytes were separated on a 15-m DB5-MS capillary column operating with a helium carrier gas of constant velocity 46 cm/s with 5 phenyl- methylpolysiloxane, 0.25 mm internal diameter, 0.1 lm film thickness. The following temperature program was used: from 90°C to 140°C at 50°C/min, to 220°C at 15°C/min and finally to 295°C at 10°C/min. The temperature of the injector was initially set at 93°C and then followed the temperature program of the oven. The temperature of the transfer line, ion source, and quadruple filter was kept constant at 300oC, 230oC, and 150oC, respectively.
Discussion
SMPCS Measurements of Aerosols
Contour plots of SMPCS measurements are shown in figures 4, 5, and 6. Contour plots at the contamination source (MLA), shown in figure 4, manifest the plant activity which occurred constantly between 07:00 till 16:00. Plots at the dismantling workshop (MLB), shown in figure 5, indicate that influence of the cable and PCB processing room is marginally evident. The two rooms are separated by a wall; thus, any influence would originate from external ambient air coming into the room rather than a direct influx between rooms.
Contour plots over the last two days at the blind spot (MLC) are shown in Figure 6. The disturbance in the high concentrations of ultra-fine particles is evident. This shows the influence of the contamination source on the external plant conditions. The density of the nanoparticles in that spot (nucleation fraction) seems to increase more than their larger particle counterparts (i.e., accumulation and Aitken particles), indicating that smaller particles travel longer distances.
Organic Substances. PBDEs and PAHs
The results of chemical analysis for PBDEs and PAHs in the aerosols are shown on Figures 7 and 8. The total concentration of PAHs is on a scale of 130 to 350 pg/m3. In PAH analysis phenanthrene, a polycyclic aromatic hydrocarbon composed of three fused benzene rings has the highest concentration of all PAH species in all measurement locations (38 to 75pg/m3). Pyrene, a PAH consisting of four fused benzene rings, resulting in a flat aromatic system with chemical formula C16H10 is also dominant (6 to 50 pg/m3). Fluorene, or 9H-fluorene, is a polycyclic aromatic hydrocarbon that also appears in notable quantities (8 to 53 pg/m3). Benzo(ghi)perylene a 6-ring polycyclic aromatic hydrocarbon with the chemical formula C22H12 appears in high concentrations at the remote point aerosols. Benzopyrene, with the formula C20H12, a pentacyclic hydrocarbon with its isomeric species, benzo(a)pyrene and benzo(e)pyrene reaches 23 pg/m3. The concentration of PAH pollutants in PM10 particles is generally higher than PM1 in all compartments checked.
The sources of PAHs can be attributed to vehicles passing the neighboring road, the milling processes of the PCBs and cables, and the operation of heavy-duty vehicles with machine tools in the yard, that use diesel fuel.
The total concentration of PBDEs ranges from 30 to 145 ng/m3. PBDE 47 and PBDE 99 have the highest concentration, ranging from 12 to around 60 ng/m3. The concentration of PBDE pollutants in PM10 particles is also higher than PM1 in all locations. The highest concentrations are observed at the dismantling workshop, therefore aerosols rich in PBDEs accumulate in the workshop. Thus, despite the fact that the contamination source does not influence directly the dismantling workshop, the accumulation and resuspension of aerosols increase the pollution burden of the territory. Another conclusion of the above analysis is that polybrominated compounds dominate the organic content of the aerosols compared to PAHs by a factor of 300/1 or more. PBDEs permeate into the aerosol phase through the dust that is created during the pulverization of the printed circuit boards. Pulverization, due to the high temperatures, is assumed to assist in the passing of the PBDEs to the airborne phase.
PDBEs may be either formed and emitted directly as small aerosol particles (chunks of recycled materials that have a diameter of the order of microns or smaller) or as gases that then condense on the emitted particles.
Exceptionally high concentrations appear for PBDE 47(2,2’,4,4’-tetrabromodiphenyl ether) and PBDE 99 (2,2',4,4',5-pentabromodiphenylether) that reach almost 60ng/m3 in the aerosols collected.
The areas mostly affected by this source of contamination are primarily the dismantling workshop and the contamination source. Despite the contamination source has the source of PBDEs contamination, small amounts of the emitted particles are transported to the neighboring area of the workshop. The transported aerosols are exceptionally rich in PAHs and PBDEs. Therefore, the overall PBDEs and PAHs contamination of the dismantling workshop is higher than in the other two territories.
The aerosols could reach the blind spots and therefore the organic contaminants could be transferred further away from the source of contamination with the help of the aerosols. For example, phenanthrene for the PM10 fraction at the blind spot reached almost 63 pg/m3 in the aerosols.
In a previous study [36] of PBDEs concentrations in offices and internet, cafés were on a scale of 100 to 200 pg/m3, significantly lower than this study, whereas PBDEs in urban areas in another work [37] were found around 4 to 45 pg/m3. These values are also well above the values measured by Deng et al. [38] (21.5 ng/m3 in total suspended particulate matter). Conclusively, PBDE concentrations in the scale of ng/m3, are orders of magnitude higher compared to concentrations found in other e-waste recycling workplaces or in general in the environment.
PAHs and PBDEs Worker Absorption Evaluation
Construction of Model
The doses received by air contaminants via factory practices rely on a variety of variables, such as the features of the compartments, the cycle of operations, the weather [39], the density of the aerosol contaminants within a dormitory, their fluctuation from day to day or even between hours [40,41], the density of aerosols (which is inversely proportional to the range from the contamination center, the existence of narrow paths and barriers inside a room - even actions of humans [42]. Attention must also be attributed to the existence and treatment of powder materials, even non-airborne dust, their dimensions, moisture, static electricity, charge [43-45], even heat transfers from the human body, and turbulences created by human limp movements [46-48]. Computational fluid dynamics (CFD) models may be effective regarding all the aforementioned, however, they produce wide errors and non-predictable results [49] as only abstract predictions regarding their impact are possible, with wide range of error [50]. Thus, in this work, these con-factors will not be regarded individually and the aerosol density will be assumed to be a continuum gradient in each independent territory [51].
A determining factor of a human’s hazardous substances intake through the lungs is the respiration rate. This is the quantity of air breathed by an average adult human within a predetermined time interval [52,53]. Researchers were able to estimate the respiration rate through the quantity of oxygen retained by the human body in comparison to the air quantity inhaled [54-56]. Age and sex patterns and four types of work intensity were also regarded in our work: Inactive, light activity, medium activity, and intense activity. Most types of tasks undertaken in the factory are executed by the use of automated machinery and tools. Direct manual tasks are very rare and occur arbitrarily during the work cycle. Thus, it is secure for the calculations to assume the work intensity of light activity
Organic Contaminants Intake Estimation
According to the calculations of EPA described before and by considering work intensity of light activity the mean volume of air intake during the entire time length of the work shift for men and women workers, and for several categories from 20 to 70 years is listed in Table 2. A more detailed calculation of the constructed model is described by Lasithiotakis et. al. 2019 [57].
By these assessments, minimum and maximum intake calculations can take place so as to estimate organic contaminants intake by an individual in PAHs and PBDEs of the particulate matter. Total absorption of particulate matter in the alveoli of the lungs is considered. The maximum values hypothesis developed in this work estimates the mean worker exposure within a day of PAHs and PBDEs, for the highest amount of air inhaled within a workday. This is 34.4 cubic meters for men in the group 20 to 30 years old. The above hypothesis regards that the individual should remain and be active in the aforementioned areas during the whole time of their shift, where the maximum concentrations of organic contaminants were observed, and for the particulate matter of range sizes of 1μm or less. A list of these results, for PBDEs and PAHs, is displayed in Tables 3 and 4.
Table 4 shows that the above results are generally below the aforementioned recommended limits. However, this does not annul the possibility for the contaminants to have synergistic effects on workers’ health. Therefore, personal protective equipment during work and good maintenance of ventilation apparatuses are recommended.
In this hypothetical case, the number of PAHs inhaled and absorbed through particulate matter within a shift is 9.1 ng, for PM10 at MLB (dismantling workshop), in the time frame of one workday is 9.1 nanograms, for PM 10 and the PBDEs around 5μg at the same location.
According to US Occupational Safety and Health Administration (OHSA), [58] the permissible exposure level for PAHs in the workplace for an 8-h time-weighted average is 200 ng/m3, which is well above the highest concentrations measured in this work. For PBDEs, there is no internationally accepted limit of intake yet. A value of 5 mg/m3 for deca-BDE, with ongoing air monitoring, has been proposed as well as 6 μg/m3 for lower brominated PBDEs [59,60] both above the values measured.
Conclusions
Particulate matter contamination could move from compartment to compartment accumulating in other areas that also resuspended fine particles. The dust was produced at the mills and granulators of the recycling lines of the printed circuit boards and cables. However, the dismantling workshop exhibited higher concentrations of aerosol organic pollutants than the recycling line. Polybrominated compounds dominate the organic content of the aerosols compared to PAHs. PBDEs can permeate and transport to longer distances into the aerosol phase through the dust. Other areas can be affected by this source of contamination such as the workshop and the blind spot. The outside blind spot exhibited lower contamination. Nevertheless, all the above results are generally below the recommended limits. However, transportation, accumulation, and resuspension of contaminants through aerosols could aggravate occupational health conditions.
References
- Savage M (2006) Implementation of the Waste Electric and Electronic Equipment Directive in the EU. EUR 22231 EN. Institute for Prospective Technological Studies 2006. European Communities.
- Fugger E, Schwarz N (2000) Disassembly and Recycling of Consumer Goods. Paper presented at the R´99 Congress (Recovery, Recycling, Re-integration).
- Wernick M, Themelis NJ (1998) Recycling Metals for the Environment. Annu Rev Energ Env 23: 465-97.
- Khaliq A, Rhamdhani MA, Brooks G, Masood S (2014) Metal Extraction Processes for Electronic Waste and Existing Industrial Routes: A Review and Australian Perspective. Resour 3: 152-79
- Kent MS, Corbett ML, Glavin M (2007) Characterization and Analysis of Airborne Metal Exposures among Workers Recycling Cellular Phones. Proceedings of the 2007 IEEE International Sympo-sium on Electronics and the Environment 112-6
- Orazio CE, Kapila S, Puri RK, Yanders AF (1992) Persistence of chlorinated dioxins and furans in the soil environment. Chemosphere 25: 1469-74.
- Mitrou PI, Dimitriadis G, Raptis SA (2001) "Toxic effects of 2,3,7,8-tetrachlorobenzo-p-dioxin and related compounds", Eur J Intern Med 12: 406 -11.
- Birnbaum LS, Staskal DF (2004) Brominated flame retardants: cause for concern? Environ Health Persp 112: 9-17.
- Danfeng Yu, Huabo Duan, Qingbin Song, Yicheng Liu, Ying Li et al. (2017) Characterization of brominated flame retardants from e-waste components in China. Waste Manag 68: 498-507.
- Alaee M, Arias P, Sjödin A, Bergmand A (2003) An overview of commercially used brominated flame retardants, their applications, their use patterns in different countries/regions and possible modes of release. Environ Int 29: 683-9
- Jenkner H. Gaechter/Mueller: plastic additives (1979) Carl Hanser Verlag, Munich, Germany, 387-415
- D'Silva K, Fernandes A, Rose M (2004) Brominated Organic Micropollutants—Igniting the Flame Retardant Issue. Crit Rev Env Sci Tec 34: 141-207
- Ebert J, Bahadir M (2003) Formation of PBDD/F from flame-retarded plastic materials under thermal stress. Environ Int 29: 711-6
- Olsman H, van Bavel B, Kalbin G, Pettersson A, Stenlund S, Strid 2, Engwall M (2002) Formation of dioxin-like compounds as photoproducts of decabrominated diphenyl ether (DEBDE) during UY irradiation. Organohalogen Compd 58:41-4.
- Lahaniatis ES, Bergheim W, Bieniek D (1991) Formation of 2,3,7,8‐tetrabromodibenzodioxin and ‐furan by thermolysis of polymers containing brominated flame retardants. Toxicol. Environ. Chem 1991: 521-6
- Zier B, Lahaniatis ES, Bieniek D, Kettrup A (1990) Formation of brominated dibenzodioxinsand furans by thermolysis of polybutylene-polybutylene – terephthalate containing decabromodiphenylether – Influence of temperature, antimony trioxide and water. In Dioxin'90 EPRI-Seminar: short papers 2: 381.
- Clausen E, Lahaniatis ES, Bahadir M, Bieniek D (1987) Bestimmung von bromierten Dibenzofuranen, die bei der Thermolyse von Polymeren mit Decabromdiphenylether als Flammschutzmittel gebildet warden. Fresenius' Zeitschrift für analytische Chemie 327: 297-300.
- Lenoir D, Zier B, Bieniek D, Kettrup A (1994) The influence of water and metals on PBDD/F concentration in incineration of decabrombiphenyl ether in polymeric matrices. Chemosphere 28: 1921-8
- Dumler R, Lenoir D, ThomaΗ, Hutzinger (1990) Thermal formation of polybrominated dibenzofurans and dioxins from decabromodiphenyl ether flame retardant: Influence of antimony(III) oxide and the polymer matrix. Chemosphere 1990; 20: 1867-73
- Vermeșan H, Tiuc AE, Purcar M (2019) Advanced recovery techniques for waste materials from IT and telecommunication equipment printed circuit boards. Sustainability 12: 74.
- Kreyling WG, Semmler-Behnke M, Möller W (2006) Health implications of nanoparticles. Journal of Nanoparticle Research 8: 543-62.
- Seaton A, Tran L, Aitken R, Donaldson K (2010) Nanoparticles, human health hazard and regulation. J R Soc Interface 7: 119-29.
- Araujo JA, Barajas B, Kleinman M, Wang X, Bennett BJ et al. (2008) Ambient particulate pollutants in the ultrafine range promote early athero-sclerosis and systemic oxidative stress. Circulation research 102: 589-96.
- Frostier F, Belled V, Faustino A, Stafoggia M, Cattani G, Marconi A (2007) Fine and ultrafine particles and hospital admissions for cardiovascular and respiratory diseases. Epidemiology 18: S112.
- Ibald-Mulli A, Wichmann HE, Kreyling W, Peters A (2002) Epidemiological evidence on health effects of ultrafine particles. Journal of Aerosol Medicine 15: 189-201.
- Peters A, Wichmann HE, Tuch T, Heinrich J, Heyder J (1997) Respiratory effects are associated with the number of ultrafine particles. Am J Resp Crit Care 155: 1376-83.
- Heal MR, Kumar P, Harrison RM (2012) Particles, air quality, policy and health. Chem Soc Rev 41: 6606-30.
- Nel A, Xia T, Madler L, Li N (2006) Toxic potential of materials at the nanolevel. science 311: 622-7.
- Oberdürster G (2000) Toxicology of ultrafine particles: in vivo studies. Philos T R Soc A 358: 2719-40.
- Schmid O, Möller W, Semmler-Behnke M, A. Ferron G, Karg E et al. (2009) Dosimetry and toxicology of inhaled ultrafine particles. Biomarkers 14: 67-73.
- Das RK, Gohatre OK, Biswal M, Mohanty S, Nayak SK (2019) Influence of non-metallic parts of waste printed circuit boards on the properties of plasticised polyvinyl chloride recycled from the waste wire. Waste Manage Res 37: 569-77.
- Liu BY, Pui DY (1974) Electrical neutralization of aerosols. J Aerosol Sci 5: 465-72.
- Knutson EO, Whitby KT (1975) Aerosol classification by electric mobility: apparatus, theory, and applications. J Aerosol Sci 6: 443-51.
- Agarwal JK, Sem GJ (1980) Continuous flow, single-particle-counting condensation nucleus counter. J Aerosol Sci 11: 343-57.
- Marple VA, Rubow KL, Behm SM (1991) A microorifice uniform deposit impactor (MOUDI): Descrip-tion, calibration, and use. Aerosol Sci Tech 14: 434-46.
- Mandalakis M, Atsarou V, Stephanou EG (2008) Airborne PBDEs in specialized occupational settings, houses and outdoor urban areas in Greece. Environ Pollut 155: 375-82.
- Mandalakis M, Besis A, Stephanou EG (2009) Particle-size distribution and gas/particle partitioning of atmospheric polybrominated diphenyl ethers in urban areas of Greece. Environ Pollut 157: 1227-33.
- Deng WJ, Zheng JS, Bi XH, Fu JM, Wong MH (2007) Distribution of PBDEs in air particles from an elec-tronic waste recycling site compared with Guangzhou and Hong Kong, South China. Environ Int 33: 1063-9.
- Saksena S, Thompson L, Smith KR (2003) The Indoor Air Pollution and Exposure Database: House-hold Pollution Levels in Developing Countries Version 1.1: July 2003. Geneva: World Health Or-ganization.
- He G, Ying B, Liu J, Gao S, Shen S (2005) Patterns of household concentrations of multiple indoor air pollutants in China. Environ Sci Technol 39: 991-8.
- Ezzati M, Saleh H, Kammen DM (2000) The contributions of emissions and spatial microenviron-ments to exposure to indoor air pollution from biomass combustion in Kenya. Environ Health Persp 108: 833-9.
- Roach SA (1981) On the role of turbulent diffusion in ventilation. Ann Occup Hyg 24: 105-32.
- Brouwer DH, Links IH, De Vreede SA, Christopher Y (2006) Size selective dustiness and exposure; sim-ulated workplace comparisons. Ann Occup Hyg 50: 445-52.
- Schneider T (1995) Physical characterization of MMVF for risk assessment. Ann Occup Hyg 39: 673-89.
- LidÉN G (2006) Dustiness testing of materials handled at workplaces. Ann Occup Hyg 50: 437-9.
- Flynn MR, George DK (1991) Aerodynamics and exposure variability. App Occup Environ Hyg 6: 36-9.
- Flynn MR, Ljungqvist B (1995) A review of wake effects on worker exposure. Ann Occup Hyg 39: 211-21.
- Welling I, Andersson IM, Rosen G, Räisänen J, Mielo T et al. (2000) Contaminant dispersion in the vicinity of a worker in a uniform velocity field. Ann Occup Hyg 44: 219-25.
- Bennett JS, Feigley CE, Khan J, Hosni MH (2000) Comparison of mathematical models for exposure assessment with computational fluid dynamic simulation. App Occup Environ Hyg 15: 131-44.
- Cherrie JW (1999) The effect of room size and general ventilation on the relationship between near and far-field concentrations. App Occup Environ Hyg 14: 539-46.
- Tielemans E, Schneider T, Goede H, Tischer M, Warren N et al. (2008) Conceptual model for assessment of inhalation exposure: defining modi-fying factors. Ann Occup Hyg 52: 577-86.
- USEPA U (1997) Exposure factors handbook. Office of Research and Development, Washington.
- U.S. EPA (Environmental Protection Assessment) (2008) Child-specific exposure factors handbook (CSEFH). National Center for Environmental Assessment, Washington, DC.
- Schofield WN (1985) Predicting basal metabolic rate, new standards and review of previous work. Human nutrition. Clinical nutrition. 39: 5-41.
- Layton DW (1993) Metabolically consistent breathing rates for use in dose assessments. Health Phys 64: 22-36.
- U.S. EPA (U.S. Environmental Protection Agency). (2009b). Risk assessment guidance for su-perfund volume I: Human health evaluation manual (Part F, supplemental guidance for inhala-tion risk assessment): Final. (EPA/540/-R-070/002). Washington, DC: U.S. Environmental Protection Agency, Office of Superfund Remediation and Technology Innovation.
- Lasithiotakis M, Psanis C, Triantafyllou E, Nikolaou P, Kouvarakis G et al. (2019) Heavy metals inhalation exposure analysis from particulate matter emitted from dry and wet recycling processes of waste electrical and electronic equipment. Environ Prog Sustain 38: e13265.
- Occupational Safety & Health Administration (OSHA) Coal Tar Pitch Volatiles
- American Industrial Hygiene Association (AIHA). 2013. “2013 EPRG/WEEL Handbook.” AIHA Guideline Foundation.
- Agency for Toxic Substances and Disease Registry (ATSDR). 2004. “Toxicological Profile for Polybrominated Biphenyls and Polybrominated Diphenyl Ethers.”
Artcle Information
Review Article
Received Date: April 29, 2023
Accepted Date: May 29, 2023
Published Date: May 31, 2023
World Journal of Environmental Science and Energy
Volume 1 | Issue 1
Citation
Michael Lasithiotakis, George Biskos, Christodoulos Psa nis, Maria Apostolaki, Minas Iakovidis et al. (2023) Occu pational Exposure Assessment of Organic Pollutants Emitted Through Aerosols from Recycling of eWaste. Environ Sci Energy 3: 1-16
Copyright
©2023 Michael Lasithiotakis. This is an open-access article distributed under the terms of the Creative Commons Attribution License, which permits unrestricted use, distribution, and reproduction in any medium, provided the original author and source are credited.

doi: jese.2021.1.3-1