

Review Article
Volume-1 Issue-1, 2025
Comparative Study on Carcass Quality Characteristics of Indigenous Chickens and Their F1-Crosses with The Sasso Chicken Breed in Sheka Zone, South Western Ethiopia
-
Received Date: April 02, 2025
-
Accepted Date: April 21, 2025
-
Published Date: April 28, 2025
Journal Information
Abstract
The study was conducted in three districts of Sheka zone in southern Ethiopia with the objective of comparing the carcass quality characteristics of indigenous and F1-crosses (indigenous and Sasso) chickens. Six Kebeles were purposely selected from the three districts. A total of 180 households were purposely selected which possess a minimum of 3 adult chickens. While from 180 households 84 households were randomly selected to assess the carcass quality characteristics of local chickens and their F1-crosses (genotype 2 and 3). For the evaluation of carcass quality traits, 84 male chickens were used that were drawn from both indigenous and F1- crossbred chickens. The results indicated that the average values of the breast, thighs, neck, liver and gizzard, all carcass component values of chickens raised in Anderacha and Masha districts were higher (p< 0.05) than those of Yeki. The highest breast and gizzard values were observed from Mash chickens and differed (p< 0.05) from those of the two districts. The F1-crosses (genotype 2 and 3) were superior in all carcass comments to the local chickens except for dressing percentage which was highest in the local chickens. From the current study it can be concluded that the F1- crosses (genotype 2 and 3) had the highest carcass potentials and could be used as meat or dual-purpose chickens under the smallholder settings. However, care must be taken for unjustified distribution of exotic chicken breeds to prevent genetic dilution.
Key words
Sheka zone; indigenous chicken; Sasso chicken; F1-crosses; Genotype 2 and 3carcass quality traits
Carcass components |
District |
Breed |
|||
Yeki |
Anderacha |
Masha |
Local |
F-crosses |
|
Live weight |
1987±383 |
1959±417 |
2005±446 |
1610±149b |
2357±185a |
Dressed carcass |
1281±192b |
1353±223a |
1390±228a |
1144±78b |
1538±101a |
Dressing percentage |
65.1±4.35b |
69.8±4.21a |
70.3±4.34a |
71.4±4.49a |
65.4±3.04b |
Breast |
151±18.2b |
156±19.2b |
176±30.0a |
142±11.6b |
180±20.1a |
Thighs |
233±40.5 |
236±39.0 |
239±38.5 |
200±14.9b |
271±15.6a |
Drumsticks |
199±31.9b |
214±44.6a |
218±41.4a |
175±15.3b |
246±20.8a |
Wings |
117±19.3b |
138±28.2a |
140±25.9a |
110±12.8b |
153±17.9a |
Neck |
69.7±13.4 |
72±11.4 |
72.7±11.5 |
61.4±5.54b |
82.1±6.7a |
Skin |
116±23.5b |
122±25.9a |
123±25.7a |
97.1±5.85b |
144±9.4a |
Keel bone |
134±15.1 |
136±18.6 |
135±16.5 |
121±6.35b |
149±9.7a |
Backbone |
196±24.3b |
206±33.4a |
213±33.6a |
177±12.6b |
233±14.0a |
Heart |
9.52±2.22b |
10.4±2.57a |
10.7±2.61a |
8.19±1.28b |
12.2±1.63a |
Gizzard |
28.5±6.01c |
31.6±4.41b |
35.1±4.77a |
28.0±4.90b |
35.4±3.81a |
Liver |
25.1±5.24 |
25.9±5.12 |
26.5±3.70 |
22.6±3.23b |
29.1±3.57a |
Variables |
Yaki |
Anderacha |
Masha |
||||||
Local Rooster |
Genotype 2 Rooster |
Genotype3 Rooster |
Local Rooster |
Genotype 2 |
Genotype 3 |
Local Roster |
Genotype 2 |
Genotype 3 Roster |
|
SW |
1645± |
2360±160b |
2297±142b |
1578± |
2314± |
2364± |
1605± |
2415± |
2391±238b |
DC |
1097± |
1469±33.24bA |
1461±46.10bA |
1153± |
1514± |
1592± |
1183± |
1592± |
1602±109bB |
DP |
67.1± |
62.42±3.14aA |
63.72±2.1aA |
73.17± |
65.58± |
67.32± |
73.8± |
66.12± |
67.20±2.76aB |
BW |
136.1± |
165±10.62bA |
167±9.65bA |
141± |
170± |
172± |
148± |
203± |
203±12bB |
TW |
195± |
272±4.75bA |
270±8.32bA |
200± |
268± |
275± |
205± |
267± |
276±23.77bA |
DW |
168.± |
232±5.31bA |
227±3.82bA |
176± |
238± |
267± |
181± |
258± |
254±20.07bB |
WW |
99.78± |
139±4.95cA |
130±5.58bA |
114± |
155± |
171± |
117± |
163± |
163±14.37bB |
NW |
57.00± |
81.14±2.19bA |
83.71±3.5bA |
63.42± |
82.85± |
81.00± |
63.7±6.19aB |
83.85 |
79.71±7.95bA |
SW |
93.78± |
137±2.19bA |
139±6.46bA |
98.53± |
143± |
151± |
98.9±5.05aB |
146± |
148±9.82bB |
KW |
120.± |
147±5.36bA |
148±6.66bA |
121± |
146± |
156± |
121±7.47aA |
150± |
149±9.48bA |
BTW |
174± |
217±4.89bA |
221±7.43bA |
177± |
234± |
238± |
181±9.49aA |
244± |
245±13.33bB |
HW |
7.67± |
10.88±0.86bA |
11.84±1.5bA |
8.21± |
12.15± |
13.07± |
8.67±1.34aB |
12.18± |
13.18±1.72bA |
GW |
23.54± |
34±3.31bA |
32.9±2.84bA |
28.34± |
33.95± |
35.57± |
32.18±3.1aC |
35.05± |
40.97±3.32bB |
LW |
20.80± |
31.81±1.76cB |
27.12±2.8bA |
22.82± |
27.87± |
30.02± |
24.12±2.37aB |
28.05± |
29.68±3.61bB |
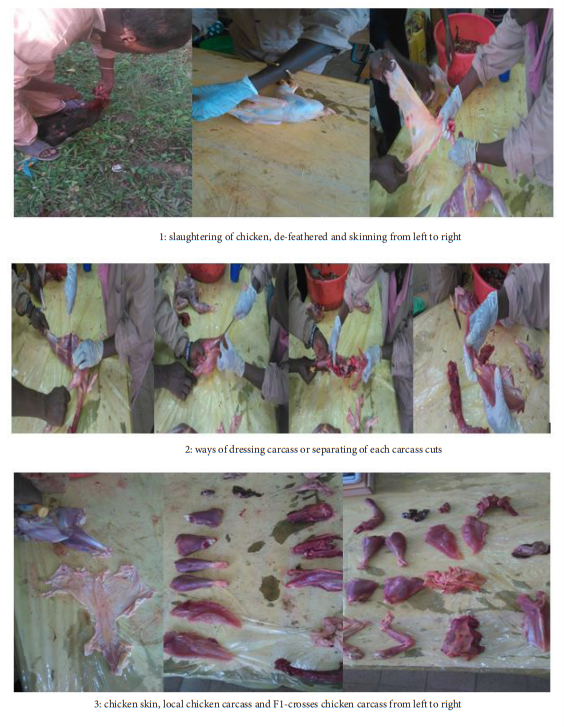 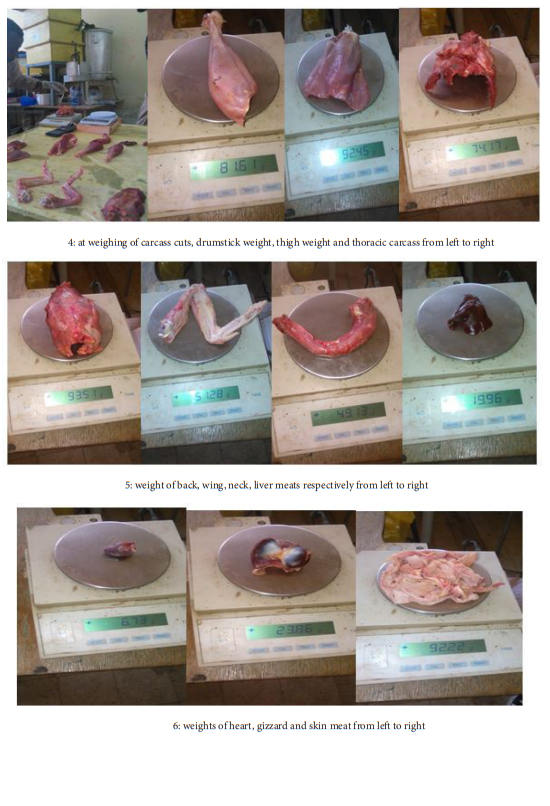 |
| Appendix Figure 1: Sample picture of carcass cut of local and F1-crosses chickens |
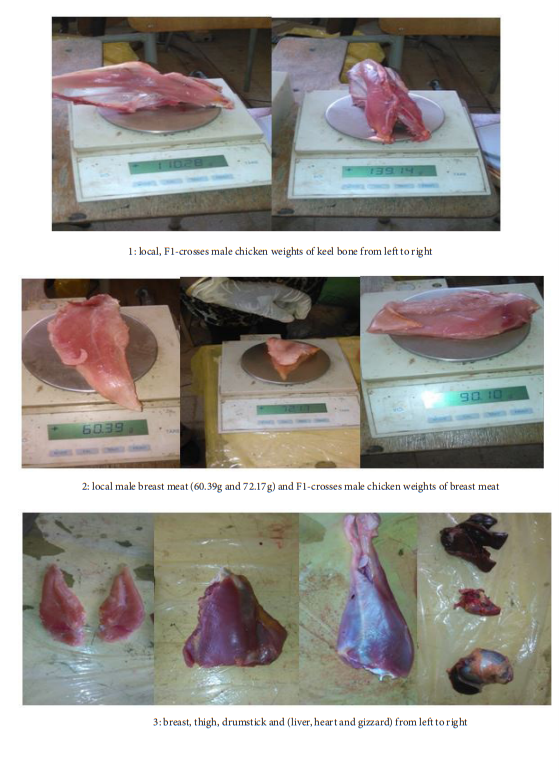 |
| Appendix Figure 2: Sample picture of carcass cut Comparetion of local and F1-crosses chickens and sample of carcass cuts |
Introduction
Ethiopia, with its wide variations in agro-climatic conditions, possesses one of the largest and the most diverse plant and animal genetic resources in the world (Azage et al., 2010). In Ethiopia the word poultry is synonymous with domestic chicken (Gallus domesticus) because other types of poultry are almost unknown as sources of egg and meat (Alemu, 1995). Indigenous poultry contribute almost 99% of the national egg and poultry meat production (Tadelle et al., 2003). Indigenous chickens are reared in the country for basic social and economic needs including cash income; hatching for replacement home consumption as well as socio-cultural and religious ceremonies (Aberra et al., 2014; Fisseha et al., 2010) [1-3].
In Ethiopia chickens are the most widespread and almost every rural family owns chickens, which provide a valuable source of family protein and income (Aberra et al., 2014). The total chicken population in the country is estimated to be 60 million of these 88.5 % indigenous chicken, while the rest 6.25% and 5.25% are highbred and exotics respectively, which are mainly kept by small holder farmers in scavenging environments (CSA, 2017/18). However; the economic contribution of the sector is not still proportional to the large chicken numbers, attributed to the presence of many productions, reproduction and infrastructural constraints (Aberra, 2000) [5-8].
Indigenous chickens are preferred over exotic chickens, because of their pigmentation, taste, flavor and leanness (Embet et al., 2013). Variations in ecology and socio-cultural preferences result in different poultry species dominating smallholder production systems in different regions of the world (FAO, 2010). However, the indigenous chicken seems to have low performances comparatively with exotic or hybrid or selected poultry breeds. In this respect, most of the studies carried out in African and Middle Eastern countries on local poultries had shown that they have low size of eggs and chicks (Fotsa et al., 2007; Kingori et al., 2010) also low parameters relative to meat and eggs performances, comparatively to usual norms in industrial poultry. This may be attributed, in addition to genetic limits, with the extensive poultry husbandry systems generally practiced by farmers and which are marked by unbalanced feeding, inadequate housing and inappropriate veterinary cares and treatments Fotsa et al., (2007). However, within the aim of poultry productivity, different breed of exotic chickens (Rhode Island Red, Australorp, New Hampshire and White Leghorns) where imported to Ethiopia since the year 1950’s. Higher Learning Institution, Research Institutions, Ministry of Agriculture (Livestock and Fishery Development Minister) and nongovernmental organizations (NGO’s) have disseminated many exotic types of chicken to farmers and urban based small-scale poultry producers (Solomon, 2003). Similarly, Sasso breeds were introduced since 2015 for improvement of chicken productivity in the study zone. The carcass quality traits of F1 crosses between local chicken and their F1-crosses with Sasso chickens breed reared in the current study area not yet studied. Therefore, the study was conducted to investigate the carcass characteristics of indigenous chickens and their F1-crosses with Sasso chicken breed [9-13].
Materials and methods
Description of the Study Area
The study was conducted in Sheka-Zone of the South Nation Nationality People Regional State (SNNPR). Administratively it is divided to three districts, namely, Masha, Yeki and Anderacha (Gecha), which are further divided into 57 peasant associations (SZLFDO, 2017). According to CSA (2007) it has a total human population of 199,671(98,439 female and 101,232 males from these 34,638 urbans and 165,033 rural) and a total surface area of 2387.5 km2 of land. According to the data from the Livestock and Fishery Development Office (LFDO), the Zone lies between 70 12’- 70 89’North latitude and 350 24’- 370 90’ East longitude with an elevation ranging 1001-3000 meters above sea level (SZLFDO, 2017). The zonal capital city Masha is situated 951 km from Hawassa and 650 km away from Addis Ababa. The zone is bordered in South by Bench Maji Zone, in South west by Gambella Regional State, in North West by Oromia Regional State, and in the Northeast by Kaffa Zone.
The zone has livestock population of Cattle (137,652), Sheep (58,806), Goats (20,212), Horses (9,661), Mules (975), Donkeys (2,576), Camels (127), Poultry (163,783), and Beehives (88,070) (CSA, 2014). The main agricultural practice in the area is, coffee plantations, spices, pulses & cereal crop production, cattle fattening, apiculture, and animal farming. According to the land utilization data of the region, 64,425.58 ha cultivated land, 4,387 ha grazing land, 115192 ha of land is covered by forest, bushes and shrub and 30,760 ha of land covered by others.
The agro-ecology of the zone includes17.61% kola (lowland), 59.81% weinadega (Mid-land), and 22.58% dega (High land) (SZLFDO, 2017). The mean annual temperature of the zone ranges between 15.1-27.5 50 Cand the mean annual rain fall ranges from 1172 to 2200mm.The climate of the area is characterized by a long rainy season (June-November) accounting for 75% of the annual rainfalls with a peak fall in September. The short rainy season extends from March to May with a peak fall in May and the dry season occurs between November and March. Agricultural seasons of the zone are “Mehar” and “Belg”. Meharis a rainy season which ranges from June to October, Belg from March to May.
Sampling Design
A purposive multi-stage and random sampling technique was used in order to determine the number of Kebeles and households to cover all the three districts. At 1st stage, after consulting the district Agricultural experts, extension agents, and key informants, about F1-crosses and 2 Kebeles from each district (in total 6 Kebeles) were selected purposively based on the availability of chickens (F1-crosses of Sasso with local) and the accessibility of the Kebeles. In the 2nd stage of sampling, 30 households (15 for local and 15 for F1-crosses) were selected purposively from each Keble, that possess a minimum of 5 adult (one year and above) F1-crossesand local chickens. The total numbers of households considered therefore were 180 (90 households that possess local chicken and 90households that possess F1-crosses chickens). For the assessment of carcass quality characteristics, eighty-four households were randomly selected from 180 households which possess 3adult chickens (1 male and 2 females from each local and their F1-crosses) were 84 males (42 from local and 42 from F1-crosses) was used for the assessment of carcass components.
Sampling Design of F1-crosses
A combination of purposive and random sampling techniques was used in order to determine the number of Kebeles and households for assessment of carcass parameters. F1-crosses accordingly, 6 Keble’s (2 from each district) was purposively selected. A total of 90 households was used from the three districts, and then from each household, 3 adult chickens (1 male and 2 Females) (one year and above) of F1-crosses was purposively selected. All crossbred chickens included in this study are the first generations of crosses (F1-crosses) that were obtained from the Sasso chicken breeds that had been distributed in 2015 in the study area and this was checked and verified by asking individual households during the survey period. For the assessment of carcass characteristics, F1 (local and Sasso F1-crosses) 42 male (roosters) chickens (i.e. 7 roosters from each Keble) were purchased randomly from sampled 90 households.
Sampling Design of Indigenous Chickens
Here also a combination of purposive and random sampling techniques was used in order to determine the number of Kebeles and households for assessment of carcass parameters. Accordingly, 6 Keble’s (2 from each district) that were free from any of exotic chicken distribution were selected purposively. From each household, 3 adult chickens (1 male and 2 Females) (one year and above) was used. Similarly, a total of 42 adult (one year and above) male (i.e. 7 rosters from each Keble) chickens was randomly purchased for carcass quality characteristic from 90 households.
Data Collection Procedures
A total of eighty-four chickens consisting of 42indigenous and 42 F1-crosses were used for the assessment of carcass characteristics. The live weight of the chickens was taken immediately before slaughtering them. Each chicken was slaughtered by cutting of jugular vein for proper bleeding; then it immersed in moderately hot water for 2 to 4 minutes in order to facilitate the defeathered process manually. Finally, all eighty-four chickens were slaughtered and the carcass was separated from the offal and the following commercial carcass components were determined: breast meat exclusive bone, thighs, drumsticks, wings, keel bone meat, skin, back + thorax, neck meat and giblets (heart, gizzard and liver). Except live weight the remaining characteristics study was measured by sensitive balance.
Statistical Analysis
All the data were analysed using the GLM procedure of Statistical analysis of software (SAS, 2012, ver. 9.4). Mean comparisons were conducted using Tukey’s Standardized Range (HSD) test. The values were considered significant at P< 0.05 unless noted otherwise.
The following statistical models were used for the analysis of the data:
Model: For carcass quality parameters and carcass characteristic traits
Yijk= μ + Bi + Dj + Bi * Dj+ Eijk
Where:
Yijk = the value of the dependent observed variables
μ = overall mean
Bi= the effect of ith chicken breed (i = local,
F1-crosses)
Dj = the effect of jth district (j=1, 2&3)
Bi * Dj= the interaction effect
Eijk = random error term
Results
Carcass Quality Traits
The average values of major carcass components of the two chicken breeds and the three districts are presented in Table 1. Except breast, thighs, neck, liver, keel bone and gizzard, all carcass component values of chickens raised in Anderacha and Masha districts were higher (p< 0.05) than those of Yeki. The highest breast and gizzard values were observed from Mash chickens and differed (p< 0.05) from those of the two districts. The F1-crosses were superior in all carcass comments to the local chickens except for dressing percentage which was highest in the local chickens.
The result related to carcass quality traits of the three-study genotype across the study locations presented in table 2; the result for slaughter weight indicated the slaughter weight values of the local rooster was lowest in all the studied location. However, there was no deference recorded in the other two genotypes. The dressed carcass values two followed the trends of slaughter at that of slaughter weight values while across the studied location (within a genotype) the result should that the dressed carcass values from the local rooster was similar at Anderacha and Masha. The trends for the other two genotypes were also similar for that of the local roosters. The results related to dressed percentage indicated that it was higher among the local rooster were compared to rooster from genotype 2 and 3 reared in all in the three locations, while the study farther indicate that dressed percentage among the local rooster were higher at Anderacha and Masha. The trends were also similar across the other two genotypes. As regards the breast weight the values among local rooster were lower at Yeki, while for the values were higher among the other two follows as that slaughter weight. However, between the locations the breast weight values at the local rooster were higher at Anderacha and Masha. The trends for genotype 2 and 3 were also similar at that of local rooster.
The thigh weight a value of the local rooster was lower in compared to the other two genotypes across all the studied location. While the thigh weight values for the rooster irrespective of genotypes did not vary across the locations. The drumstick weight values indicated that it was lower amongst the local rooster reared at Yeki with no difference between the other two genotype 2 and 3 while at Anderacha the local rooster had low drumstick values but, were higher among genotype 3 located at Anderacha. As regarded Masha the value was lower among local rooster with no differences between other two genotypes. The wing weight result indicated to wing weight of indicated the value was lowest among the local rooster at Yeki while it was highest among the rooster of genotype 2 reared in the same location. As regards Anderacha it was the rooster of genotype 3 which had highest values for the trait with lower values among the local rooster again. While at Masha the local rooster had the lower values with no differences in the other two genotypes. Across the studied locations the local rooster reared at Anderacha and Masha had higher values for the traits when compared to those reared at Yeki. As regards the genotype 2 the wing weight values were higher among those reared at Anderacha and Masha.
The result related to neck weight showed that it was higher among the roosters of genotype 2 and 3 reared at Yeki these trends was also observed in the other two locations. While across the locations the neck weight of local chickens was lowest at Yeki while those of genotype 2 did not vary across locations. The trend was also similar for genotype 3. The skin weight value was lower for the local chickens across all the studied area with no differences observed between genotype 2 and 3 at Yeki and Masha while at Anderecha genotype 3 had values for the traits. As regards values across the districts the trends indicated skin weights were lower among all the genotypes reared at Yeki when compared to those reared at the other two locations. The keel weight value of the local rooster was lower across all the locations while there were no differences between genotype 2 and 3 reared at Yeki and Masha. The keel weight values did no vary among the rooster irrespective of genotype reared in all the three locations. The back weight of the local genotypes was lower among all the study location with no differences in the other two genotypes in all the locations studied.
As regard between district the variation were observed only in genotype 2 and 3 with lower values recorded at Yeki. The heart weights of local chickens were lower in all the studied location s with no difference between the other two genotypes. As regarded across districts variation the value was consistent across the all the genotypes. The gizzard weight of the local chicken was lower at Yeki while no differences in the other two genotypes. The trend was similar at Anderacha but, at Masha gizzard weight of genotype 3 was higher than the other two genotypes. As regards the gizzard weight values across the studied districts it indicates that among the local rooster that the value was highest at Masha followed by those reared at Anderacha. There were no differences across locations for genotype 2 while for genotype 3 gizzard weights were higher among those reared at Masha with values being lowest among the rooster reared at Yeki. As regards liver weight the value was highest amongst the genotype 2 reared at Yeki while at Anderacha the values higher among rooster of genotype 3, at Masha there were no differences between genotype 2 and 3 for the trait however the values were higher than the roosters of local genotype. As regards the location liver weight did not vary among local chicken reared across the three locations. However, there were highest amongst genotype 2 reared at Yeki and genotype 3 reared at Anderacha. Discussion
Carcass Quality Traits
In the current study, except the dressing percentage, the remaining carcass components of local rooster chicken were lower than those of F1-crossbred (genotype 2 and 3) chickens reared in Yeki, Anderacha and Masha among breeds, which could be attributed to the genetic potential of the Sasso breed that has been introduced to the local chicken through crossbreeding.
Similarly, the live weight (slaughter weight) of the local, genotype 2 and 3 chicken were 1645, 2360, 2297g; 1578, 2314, 2364g and 1605, 2415, 2394g of Yeki, Anderacha and Masha district, which was higher than the findings of Halima (2007) for indigenous and RIR commercial chicken breeds. On the other hand, the average live weight of the current study is lower than the findings of Iqbalet al. (2009) for indigenous chicken raised in Kashmir. However, the average live weight of rooster F1-crosses (genotype 2 and 3) of the current finding is comparable with that of Ramokoneet al. (2016) reported for indigenous rooster chicken in South Africa. The differences in body weight of local scavenging chickens raised in various regions might be due the variations in genetic makeup of chickens, management system and environmental condition Yousifet al. (2014) and Magalaet al. (2012) [14-19].
The dressed carcass weights of local rooster chicken were lower than the F1-crosses (genotype 2 and 3) chickens among and within three districts. However, the dressed carcass weights of genotype 2 and 3 chickens reared were no significant difference among districts. These differences might be due to the result of the introduction of improved genetic blood into the local chicken as well as the management, feed type and environmental variations among the districts. The average dressed carcass weight for local rooster chickens of the current finding is lower than that of Ramokoneet al. (2016) who reported 1303 and 1282g for South African Ovambo and Potchefstroom Koekkoek indigenous chickens that were reared under intensive management. However, the value was higher than reported by Youssao et al. (2012) for savannah and forest chickens. Such differences might be due to the genetic makeup, management system, environmental condition and ages of rearing local chickens considered in the study. The observed dressing percentage of 67.1, 62.42, 63.72%; 73.17, 65.58, 67.32%and 73.8, 66.12, 67.2% for local, genotype 2 and 3 chickens reared in Yeki, Anderacha and Masha district respectively. This was in line with the finding of Alemu and Tadelle, (1997). However, the current it is higher than the value reported by Yousif et al. (2014) for the exotic strains and native chicken ecotypes of Sudan and Sanchai et al. (2008) for thai native chickens and their crosses with Barred Plymouth Rock under intensive management system.
The average dressing percentage of local chicken was higher than reported by Halima (2007) who reported an average value of 65.7% for three chicken ecotypes reared in North western Ethiopia. Furthermore, the average dressing percentage of local chicken in the current study is in line with the findings of Magala et al. (2012) reported for local Ugandan chicken; but was higher than those reported by Aberra et al. (2013) for Koekoek chickens. This variation might be due to age of the chicken when slaughtered and carcass components that were included in the dressed carcass during the calculation of the dressing percentage. Another appealing finding of the current study is that the dressing percentage of local chickens was significantly higher than that of the F1-crossbred (genotype 2 and 3) chickens. This phenomenon might be explained by the small slaughter weight of local chickens relative to its dressed carcasses. Moreover, it might be due the presence of more offal in the carcass of F1- crosses (genotype 2 and 3) than that of the local chicken.
In general, the average carcass yield of the carcass cuts of local chickens was lower than the F1-crosses (genotype 2 and 3) which are apparently attributed to the improved genetic makeup of the Sasso chicken breed. Most of the carcass components in the current study were higher than the findings of Youssaov et al. (2012) and Yousif et al. (2014) reported for both F1-crosses and native chickens. However, values of different carcass cuts reported by Ramokone et al. (2016) for Ovambo and Potchefstroom Koekoek indigenous chickens in South Africa were higher than those observed in the current study. These variations might be attributed to dissimilarities of chicken ecotypes in their genetic makeup as well as the type of management system used by the producers and or researchers [18-22].
Summary
The research was conducted in Sheka zone with the objectives of assessing the carcass quality traits of local chickens’ and their F1- crosseswith Sasso chicken breed which has been introduced in the study area since 2015. The carcass components were carried out on 84 adult chickens in which 42 local and 42 F1-crossbred (genotype 2 and 3) chickens were used. The results indicated that the F1-crosses (genotype 2 and 3) chickens reared within three districts had higher (p< 0.05) values of all carcass quality traits than the local chickens except, dressing percentages. The average values of carcass quality traits, except breast, thighs, neck, liver and gizzard, all carcass component values of chickens raised in Anderacha and Masha districts were higher (p< 0.05) than those of Yeki. The highest breast and gizzard values were observed from Mash chickens and differed (p< 0.05) from those of the two districts. The F1-crosses (genotype 2 and 3) were superior in all carcass comments to the local chickens except for dressing percentage which was highest in the local chickens.
Conclusions and Recommendations
The current study indicated that the F1-crossbred (genotype 2 and 3) chickens were superior to local chickens in carcass quality traits and can be recommended as meat or dual-purpose chickens in the study area. However, care must be taken not to completely dilute the local genetic resources through unjustified distribution of exotic chicken breeds in the study area. Finally, a comparative on-farm performance study in the adaptability and disease resistibility potentials, preference of the farmers of both genotypes and market acceptability of local chickens, pure Sasso chicken breed and their F1-crosses (genotype 2 and 3) is recommended as future researchable area.
Appendix Figure 1: Sample picture of carcass cut of local and F1- crosses chickens
References
- Aberra M (2000) Comparative Studies on Performance and Physiological Responses of Ethiopian indigenous (‘Angete-melata’) Chicken and their F1 crosses to long term Heat Stress, Martin-Luther University, Halle-Wittenberg, Berlin, Germany: 182.
- Aberra M (2014) Significance of Scavenging Chicken Production in the Rural Community of Africa for Enhanced Food Security, Small-scale Family Poultry Production.World’s Poultry Science J 70: 1.
- Aberra M, Yoseph G, Kefyalew B, Benerijee S (2013) Effect of Feeding Graded Levels of MoringaStenopetala Leaf meal on Growth Performance, Carcass Traits and Some Serum Biochemical Parameters of Koekoekchickens. Livestock Science.157: 498-505.
- Alemu Y (1995) Poultry production in Ethiopia. World’s poultry science J 51: 197-201.
- Alemu Y, Tadelle D (1997) The status of Poultry research and development in Ethiopia.Proceeding of the 5th National Conference of Ethiopian Society of Animal Production (ESAP) 15-17 May, 1997, Addis Ababa, Ethiopia.
- Azage T, Berhanu G, Hoekstra D (2010) Livestock Input Supply And Service Provision in Ethiopia: Challenges and Opportunities for Market Oriented Development. IPMS (Improving Productivity and Market Success) of Ethiopian Farmers Project Working Paper 20. ILRI (International Livestock Research Institute), Nairobi, Kenya. 48.
- CSA (2007) Statistical Report on Population and Housing Census.Volume I, Addis Ababa.
- CSA (2014) Statistical Report on Livestock and Livestock Characteristics (Private Peasant Holdings). Statistical Bulletin 570.
- CSA (2017/18) The Annual Agricultural Sample Survey. Report on Livestock and Livestock Characteristics. The Federal Democratic of Ethiopia.Central Statistical Agency.Privet Holdings.Statistical Bulletin 585, Addis Ababa, Ethiopia.
- EmbetMoreda S Hareppal, A Johansson, T Sisaye, Z Sahile (2013) Characteristics of Indigenous Chicken Production System in South West and South Part of Ethiopia. British J Poultry Sciences 2: 25-32.
- FAO (2010) Smallholder Poultry Production – Livelihoods, Food Security and Socio-Cultural Significance, By K. N. Kryger, K. A. Thomsen, M. A. Whyte and M. Dissing. Fao Smallholder Poultry Production Paper No. 4. Rome.
- Fisseha M, Azage T, Tadelle D (2010) Indigenous Chicken Production and Marketing Systems in Ethiopia: Characteristics and Opportunities for Market-Oriented Development. Working Paper No.24; Improving Productivity and Market Success (IPMS) Of Ethiopian Farmers Project, International Livestock Research Institute (ILRI). Addis Ababa, Ethiopia, 66.
- Fotsa JC, Bordas A, Rognon X, Tixier-Boichard M, Pone Kamdem D, et al. (2007) Caractérisation Des Élevageset Des Poules Locales etComparaison en Station De LeursPerformances À Cellesd’unesoucheCommerciale De Type Label Au Cameroun. Journée De La Rechercheavicole, 7: 414-7.
- Halima H (2007) Phenotypic and Genetic Characterization of Indigenous Chicken Populations in North-West Ethiopia. Ph.D Thesis.Submitted to the Faculty of Natural and Agricultural Sciences Department of Animal, Wildlife and Grassland Sciences. University of the Free State, Bloemfontein, South Africa.
- IAK Youssao1, IT Alkoiret, M Dahouda, MN Assogba, ND Idrissou4, et al. (2016). Comparison of Growth Performance, Carcass Characteristics and Meat Quality of Benin Indigenous Chickens and Label Rouge (T55×Sa51), African J Biotechnology 11:1556915579,
- Iqbal S, ZA Pampori, D Hasin (2009) Carcass and Egg Characteristics of Indigenous Chicken of Kashmir (Kashmir Favorella). Indian J Anim Res 43: 194-6.
- Kingori AM, Wachira AM, Tuitoek JK (2010) Indigenous Chicken Production in Kenya: A Review. Intern J Poultsci 9: 309-16.
- Magala H, Kugonza D, Kwizera H, Kyarisiima C (2012) Influence of Management System on Growth and Carcass Characteristics of Ugandan Local Chickens. J Animal Science Advancesv 2: 558-67.
- Ramokone Motsepe, Monnye Mabelebele, David Norris, David Brown, Jones Ngambi, et al. (2016) Carcass and Meat Quality Characteristics of South African Indigenous Chickens.
- Sanchai Jaturasitha, Autchara Kayan, Michael Wicke (2008) Carcass and Meat Characteristics of Male Chickens Between Thai Indigenous Compared with Improved Layer Breeds and Their F1-crosses. Department of Animal Science, Faculty of Agriculture, Chiang Mai University, Thailandarch. Tierz., Dummerstorf 3: 283-94.
- Solomon D (2003) Growth Performance and Survival of Local and White Leghorn Chickens Under Scavenging and Intensive Systems of Management in Ethiopia. Livestock Research for Rural Development 15: 11.
- Tadelle D, Million T, Alemuy, Peter K (2003) Village Chicken Production System in Ethiopia. Use Patterns and Performance Evaluation and Chicken Products And Socio-Economic Function of Chicken. Humboldt University of Berlin, Animal Breeding For Tropics and Sub Tropics, Berlin, Germany.
Artcle Information
Review Article
Received Date: April 02, 2025
Accepted Date: April 21, 2025
Published Date: April 28, 2025
Journal of Foodscience Nutrition and Public Health
Volume 1 | Issue 1
Citation
Walelegne Alemneh (2025) Comparative Study on Carcass Quality Characteristics of Indigenous Chickens and Their F1-Crosses with The Sasso Chicken Breed in Sheka Zone, South Western Ethiopia. J Food Sci Nutr Public Health 1: 104
Copyright
©2025 Walelegne Alemneh. This is an open-access article distributed under the terms of the Creative Commons Attribution License, which permits unrestricted use, distribution, and reproduction in any medium, provided the original author and source are credited.

doi: jfnp.2025.1.104