

Review Article
Volume-1 Issue-1, 2025
Dose Distribution and Neutron Spectra Around a D-D Neutron Generator Using Bubble Detectors
-
Received Date: July 06, 2025
-
Accepted Date: July 24, 2025
-
Published Date: July 31, 2025
Journal Information
Abstract
Neutron Radiation fields around a DD neutron generator at the Ontario Tech University neutron facility have been characterized. The facility is located in a heavily shielded room of 100 cm high-density concrete. The measured neutron spectra, as well as neutron equivalent dose rate, have been performed at 50μA and 120 kV. A series of experiments using a set of personal neutron bubble dosimeters as well as a neutron bubble spectrometer were carried out. An automatic bubble reader was used to count the number of bubbles. The measurements were performed at 900 relative to the neutron generator's central access and at distances ranging from 15 to 100 cm away from the neutron generator. The personal bubble dosimeter data agrees with the dose value measured with a tissue-equivalent proportional counter, however, the bubble spectrometer over-predicts the dose rate value.
Key words
Neutron Generator; Neutron Dose; Bubble Detector; Neutron Spectra
Bubble spectrometer |
Personal bubble dosimeter |
|||
Name |
Threshold, MeV |
Sensitivity, bubble/μSv |
name |
Sensitivity, bubble/μSv |
BDS10 |
0.01 |
0.19 |
PBD1 |
0.14 |
BDS100 |
0.1 |
0.12 |
PBD2 |
0.16 |
BDS600 |
0.6 |
0.19 |
PBD2 |
0.12 |
BDS1000 |
1 |
0.18 |
|
|
BDS2500 |
2.5 |
0.13 |
|
|
BDS10000 |
10 |
0.41 |
|
|
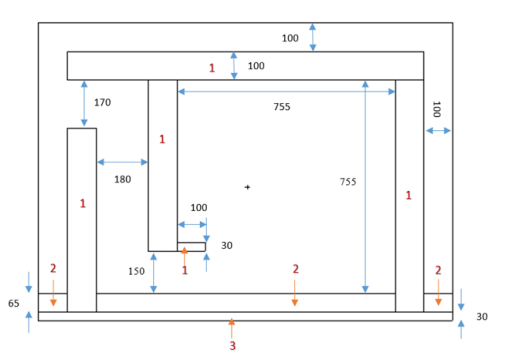 |
| Figure 1: Top view of the neutron facility room (dimensions are in cm) |
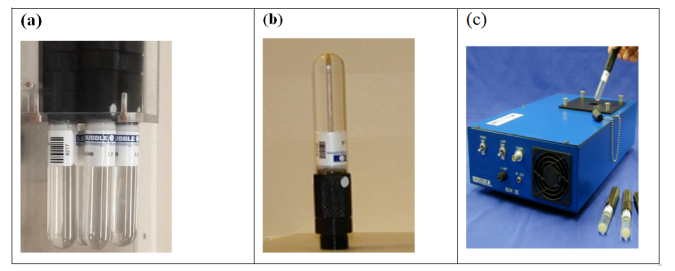 |
| Figure 2:(a) Bubble Spectrometer (b) Personal Bubble Dosimeter and (c) Bubble Reader |
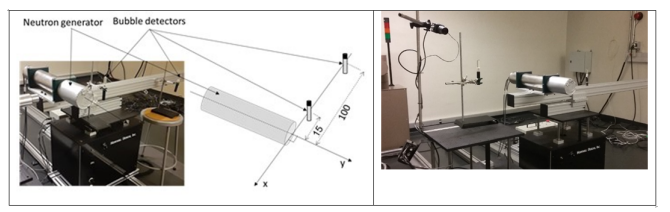 |
| Figure 3:Experimental Setup |
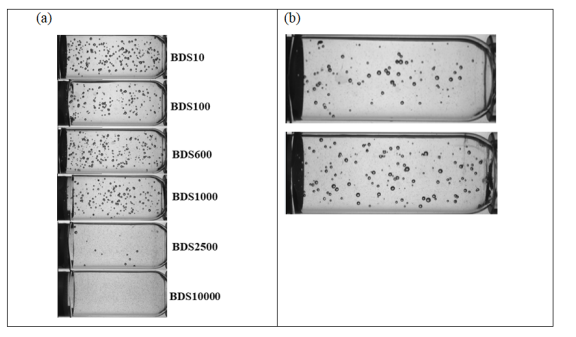 |
| Figure 4: Images of the bubble spectrometer and two personal bubble dosimeters read by the bubble reader |
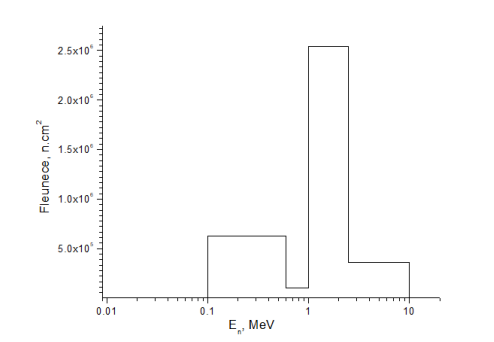 |
| Figure 5: Spectral fluence measured with the bubble spectrometer. |
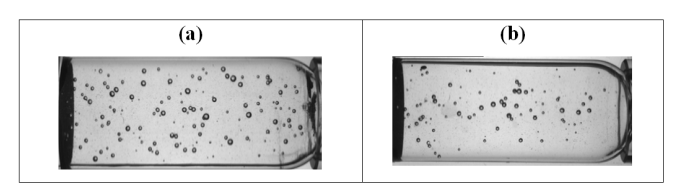 |
| Figure 6: Bubble reader images of two personal bubble dosimeters used in the experiment (a) dosimeter with 0.16 b/μSv and (b) dosimeter with 0.12 b/μSv. |
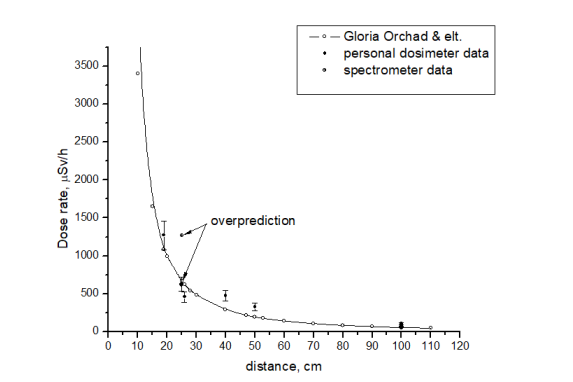 |
| Figure 7: Dose equivalent rate as a function of distance |
Introduction
Since their discovery, neutrons have played a pivotal and dynamic role in the fundamental study of matter structure as well as in various industrial applications. To meet the requirements for neutrons in different fields of basic research and nuclear applications, much effort has been devoted to the development of suitable neutron sources. As opposed to a nuclear reactor, neutron generators have been considered as a unique tool for a reasonable neutron flux at the desired time for research and industrial applications. Nowadays, advanced technologies allow having neutron generators with high neutron yield, different neutron energies, and a long operation lifetime. A DD neutron generator has been installed at Ontario Tech University as a tool for research and training in the nuclear engineering program at the faculty of energy systems and nuclear sciences.
In a previous paper, we reported the description of the facility and data evaluation of the neutron field around the neutron generator [1]. The current work aims to provide the spectral distributions of neutron emission as well as neutron dose rates in the vicinity of the neutron generator. A series of experiments have been carried out with a neutron bubble spectrometer as well as a set of neutron personal bubble dosimeters. The obtained experimental data have been compared with the measurement carried with a tissue-equivalent proportional counter [2].
Experimental Setup and Methodology
Neutron Generator Description
The neutron generator is a Thermo-Scientific P-385 D-D model that generates neutrons with an average energy of approximately 2.5 MeV from the following reaction:
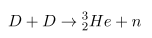
It was installed along with a 10Ci gamma irradiator at the Energy Research Center at the Ontario Tech University in Oshawa, Canada. The P-385 generator was operated with a high voltage of 150 kV and a beam current of 50 μA. The energy of the emitted neutron depends on the energy of the accelerated deuteron and the angle of emission with respect to the deuteron ion beam direction. The neutron facility is hosted in a specifically shielded room surrounded by control rooms, and laboratories housing auxiliary support equipment. A top view of the facility is shown in Figure 1.
The generator is placed at the center of a 775 x 775 cm square room, with a height of 400 cm in the basement of the Energy Research Center building. Three of the four sides of the room are composed of heavy concrete of density 3.8 g/cm3. All the heavy concrete walls are 100 cm thick. The side, backed with ground soil, has a wall constructed from ordinary concrete with a density of 2.35 g/cm3[1].
Bubble Detectors and Bubble Reader
The bubble detectors used in this investigation were space type bubble detectors similar to those used in the space radiation research program aboard the International Space Station. Each detector has a 10 ml active volume with approximately 104 microscopic droplets, and a sensitivity ranging from 0.14 to 0.20 bubbles/μSv [3]. The personal neutron bubble dosimeter referred to as PBD is a single-tube detector that produces visible bubbles when exposed to specific forms of radiation [3]. The neutron bubble detector spectrometer (NBDS) is a set of six bubble detector tubes referred to as BDS10, BDS100, BDS600, BDS1000, BDS2500, and BDS10000 [4]. Each of the BDS detectors has a neutron energy threshold for bubble formation as listed in Table 1. In a neutron spectrum measurement, all six bubble detectors are simultaneously exposed to the same radiation field. After irradiation, the number of bubbles in each of the six detectors is counted with the bubble reader. The number of bubbles is related to the fluence of neutrons above the minimum energy threshold for each detector. An automatic bubble reader was used to perform the bubble counting after each exposure. Both the detectors and the automatic reader, shown in Figure 2, were manufactured by Bubble Technology Industries (BTI).
Experimental Setup
The bubble detectors were exposed to neutrons of 2.5 MeV energy emitted at 90ºrelative to the axis of the neutron generator. A series of experiments have been carried out at different distances from 15 to 100 cm away from the neutron generator. The experimental setup is shown in Figure 3. For the personal neutron bubble dosimeter, the dose was obtained by dividing the number of recorded bubbles by the sensitivity of the detector, while for the neutron bubble spectrometer, the neutron spectra were extracted using the response matrix of the spectrometer which is a 6x6 matrix based on the six energy bins defined by the thresholds of the SBDS detectors. The matrix was obtained based on a series of data collected in different experiments. The unfolding techniques along with the value of the matrix entries were reported in [4].
Results and Discussion
The images of the six detectors of the spectrometer read by the bubble reader are shown in Figure 4(a). The bubble detector BD10000 does not show any bubbles since its threshold is 10 MeV and at 900, the neutron energy is only 2.5 MeV. The remaining five bubble detectors show a different number of bubbles depending on their threshold and sensitivity
The recorded number of bubbles in each tube was used along with the response matrix of the spectrometer and the neutron spectra were extracted in six energy bins as shown in Figure5.
One can see that the spectrometer predicts the 2.5 MeV peak of the neutrons emitted at 900. There are some neutrons on the left side of the peak due to the scattered neutrons from the surroundings.
The dose rate was also extracted from the readings of the bubble spectrometer tubes and the data suggest that the bubble spectrometer overpredicts the dose rate. Such an overprediction may be due to the uncertainty in the response function matrix of the spectrometer.
Along with the bubble spectrometer, three personal bubble dosimeters were used in the experiments with different sensitivity ranging from 0.12 to 0.16 bubble/μSv. All three dosimeters were simultaneously exposed to neutrons emitted at 900. The images from the bubble reader of two bubble dosimeters are shown in Figure 6. The number of bubbles was counted and the neutron dose equivalent was extracted as a function of the distance from 15 to 100 cm away from the central axis of the neutron generator. The dose value was averaged from the readings of all three detectors. The data were compared with those carried with a tissue-equivalent proportional counter reported in [2]. The obtained results are presented in Figure 7, and both data sets show a reasonable agreement. This investigation is a part of the characterization program of the facility to study mixed neutron/gamma radiation fields along with radiation detector development. Therefore, the confirmation of the dose rate, measured in the previous study at different distances, provides a quantitative value that can be delivered for testing the performance of other neutron devices under development.
Conclusion
Neutron fields at the Ontario Tech University neutron facility have been characterized. The DD neutron generator was operated at 50μA and 150kV. The neutron spectra and ambient dose equivalent rates with neutron energy of 2.5MeV have been measured from 15 to 100 cm away from the neutron generator. Three personal bubble dosimeters and a bubble spectrometer were used in the experiments. The measured data with personal bubble dosimeters were compared with a tissue equivalent proportional counter and both sets of data show a reasonable agreement. However, the bubble spectrometer overpredicts the dose rate value.
Acknowledgments
The authors would like to thank NSERC for supporting this work.
References
- L Kicka, R Machrafi, A Miller, (2017) Study of neutron fields around an intense neutron generator Applied Radiation and Isotopes, 130: 276-9
- GM Orchard, T Hatakeyama, AJ Waker, (2017) The spatial dose rate and energy characterization of a P 385 D-D Neutron Generator using a nested neutron spectrometer and a tissue equivalent proportional counter, Radiation Measurements, 97: 35-41.
- R Machrafi, K Garrow, H Ing, MB Smith, HR Andrews, et al. (2009) Neutron dose study with bubble detectors aboard the international space station as part of the Matroshka-R experiment, Radiation Protection Dosimetry, 1-8.
- MB Smith, Yu Akatov, HR Andrews, V Arkhangelsky, IV Chernykh, et al. (2012) Measurements of the neutron dose and energy spectrum on the International Space Station during expeditions ISS-16 to ISS-21, Radiation Protection Dosimetry, 1-25
- Rossana C Falcão, Alexandre P Jorge, Carlos Eduardo V DeAlmeida, (2009) NEUTRON Spectrometry with bubble detectors, International Nuclear Atlantic Conference - INAC 2009, Rio de Janeiro, RJ, Brazil.
Artcle Information
Review Article
Received Date: July 06, 2025
Accepted Date: July 24, 2025
Published Date: July 31, 2025
Journal of Nuclear Science and Technology
Volume 1 | Issue 1
Citation
R. Machrafi, Eyad Tamimi, Mohsen Kheradmand Saadi (2025) Dose Distribution and Neutron Spectra Around a D-D Neutron Generator Using Bubble Detectors. J Nucl Sci Tech 1: 104
Copyright
©2025 R. Machrafi. This is an open-access article distributed under the terms of the Creative Commons Attribution License, which permits unrestricted use, distribution, and reproduction in any medium, provided the original author and source are credited.

doi: jnst.2025.1.104