

Review Article
Volume-1 Issue-1, 2025
Incidence and Severity of Rice Sheath Blight Disease under Elevated Carbon Dioxide and Nitrogen Management
-
Received Date: January 07, 2025
-
Accepted Date: January 24, 2025
-
Published Date: January 31, 2025
Journal Information
Abstract
Sheath blight is a major disease that cause enormous economic losses in rice depending on severity. Atmospheric carbon dioxide (CO2) regulates the physiological phases of rice plant and might influence disease development. A pot experiment was conducted inside open top chamber (OTC) during aman 2017 to quantify the effect of elevated CO2 (eCO2) on incidence and severity of rice sheath blight disease under various times of nitrogen (N) applications. Rice plants were grown under four growing conditionsOTC with eCO2 (500 ppm), OTC with intermediate CO2 (450 ppm, iCO2), OTC with ambient CO2 (aCO2) and open field. Nitrogen as urea was applied 1/3rd at early tillering (ET) + 1/3rd at active tillering (AT) + 1/3rd before panicle initiation stage (PI), 1/3rd at ET + 1/3rd before PI + 1/3rd at booting stage, and 1/3rd at ET + 1/3rd before PI + 1/3rd at flowering stage. A randomized complete block design with eight replications was used for the experimentation. The incidence of sheath blight was 39.40% with eCO2, which was 17.36% lower than open field. The incidence of sheath blight disease was similar with iCO2, aCO2 and open field conditions. Further, the severity of sheath blight was half in iCO2 and one third in open field condition as compared to that of eCO2 condition. Maximum disease severity was increased @ 500 ppm CO2 condition over control treatment. Application of N up to flowering stage reduced disease occurrence considerably with higher CO2 condition. Therefore, this study suggested that the N application up to flowering stage might be helpful in future as adaptation of rising atmospheric CO2 levels.
Key words
Open Top Chamber; Nitrogen Application Scheduling; Variable Co2 Levels; Yield Loss
Scale |
Description |
0 |
No infection observed |
1 |
Lesions limited to lower 20% of the plant height |
3 |
20-30% |
5 |
31-45% |
7 |
46-65% |
9 |
More than 65% |
Months |
Dates |
Temperature (oC) |
|||
Open air |
OTC with aCO2 |
OTC with iCO2 |
OTC with eCO2 |
||
Wet season (2017) |
|||||
September |
10 |
28.0 |
30.6 |
30.5 |
31.7 |
20 |
28.0 |
30.2 |
30.2 |
31.7 |
|
30 |
29.0 |
30.5 |
29.7 |
30.1 |
|
October |
10 |
28.0 |
29.4 |
29.8 |
30.7 |
20 |
27.0 |
25.8 |
28.4 |
28.6 |
|
30 |
25.5 |
27.0 |
28.1 |
26.9 |
|
November |
10 |
25.0 |
25.3 |
25.8 |
27.6 |
20 |
24.5 |
22.8 |
23.8 |
26.1 |
|
30 |
21.8 |
21.5 |
21.6 |
22.8 |
|
December |
10 |
20.0 |
20.3 |
22.1 |
22.3 |
20 |
20.9 |
19.8 |
19.8 |
21.0 |
|
Growing condition |
Disease incidence (%) |
Mean |
||
N1 |
N2 |
N3 |
|
|
eCO2 |
49.52 |
30.78 |
37.89 |
39.40 |
iCO2 |
22.49 |
8.00 |
12.64 |
14.38 |
aCO2 |
7.56 |
18.21 |
21.27 |
15.68 |
Open air |
19.31 |
24.15 |
8.61 |
17.36 |
LSD0.05 |
|
|
|
|
CO2 |
|
3.21 |
|
|
Nitrogen (N) |
|
NS |
|
|
CO2 × N |
|
6.3 |
|
|
CV (%) |
|
12.5 |
|
|
Growing |
Disease severity (%) |
Mean |
||
N1 |
N2 |
N3 |
|
|
eCO2 |
60.49 |
51.85 |
59.25 |
57.20 |
iCO2 |
29.62 |
25.92 |
33.33 |
29.62 |
aCO2 |
18.51 |
29.63 |
20.99 |
23.04 |
Open air |
11.11 |
20.99 |
22.22 |
18.11 |
LSD0.05 |
|
|
|
|
CO2 |
|
4.8 |
|
|
Nitrogen (N) |
|
NS |
|
|
CO2 × N |
|
7.8 |
|
|
CV (%) |
|
15.6 |
|
|
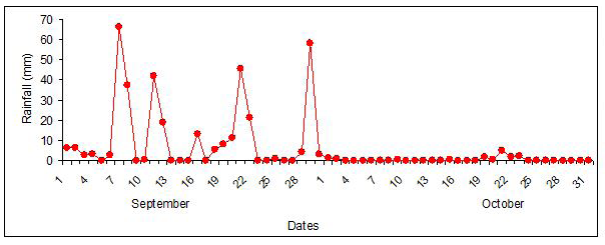 |
| Figure 1: Monthly rainfall pattern of the experimental site |
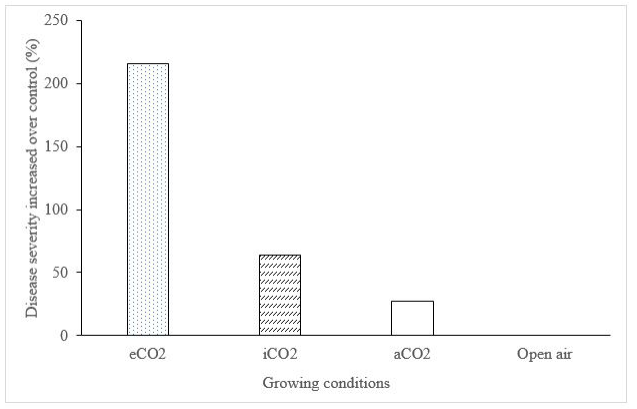 |
| Figure 2: Effect of elevated CO2 concentrations on rice sheath blight disease severity eCO2, iCO2 and aCO2indicate 500, 450 and 400 ppm CO2,respectively |
Introduction
Global climate has been changing due to emission of diverse greenhouse gases (GHGs) to the atmosphere. Among the different GHGs, the atmospheric CO2 is one of the primary drivers of global warming because it is increasing rapidly. The Intergovernmental Panel on Climate Change (IPCC) projected that the CO2 will increase from currently 381 μmol mol−1 to at least 550-936 μmol mol−1 which will cause the global surface temperature to increase by an average of 1.5-4.5 oC by the end of the 21st century (IPCC, 2013) [1].
This change of climate is altering the climatic factors like temperature, rainfall and solar radiation and thus influencing agricultural production. The atmospheric CO2 is one of the most important variables that regulate the physiological and phenological phases in plant (Dwivedi et al., 2017) [2]. Therefore, it is imperative to quantify the effect of rising atmospheric CO2 on crop (Prakash et al., 2017) [3]. As temperature is rising, plant diseases are most likely to increase in future and this will directly affect global agricultural productivity (IPCC, 2007) [4]. Disease risk analyses based on host–pathogen interactions should be performed on host response for delineation of possible adaptation mechanism in future. In Asia, about 14.2% of the potential production costing about US$ 43.8 billion is lost due to diseases (Oerke, 1994) [5].
Generally, rice crop is suffered by more than 32 diseases of which 10 diseases are more common on rice varieties (BRRI, 2020) [6]. Among the different diseases, sheath blight, bacterial leaf blight, blast and sheath rot are considered important disease at various parts of rice growing areas of Bangladesh. Sheath blight is an important soil borne disease caused by Rhizoctonia solani that can cause up to 25 per cent yield loss (Kumar et al., 2009) [7].
The N is considered as the key nutrient element in improving rice yield and timing of N application is always important for rice. The application of N at early growing stage mainly contributes to the vegetative development and makes plant bushy and produce higher shoot dry matter (Jemberu et al., 2015) [8]. However, the rice sheath blight disease develops quickly during flowering when the rice canopy is most dense, forming a microclimate favorable to pathogen growth and spread (Brook, 2007) [9]. Visible plant disease symptoms include formation of lesions and plant lodging. Large lesions formed on infected sheaths of lower rice leaves may lead to softness of the stem thereby initiating stem lodging (Wu et al., 2012) [10]. Moreover, N application at panicle initiation stage is better than mid-tillering in terms of N supply for spikelet formation (Miah et al., 2016) [11]. Therefore, present study was undertaken to determine the interactive effect of eCO2 and various time of N application on incidence and severity of rice sheath blight disease.
Materials and Methods
A pot experiments was conducted inside OTC at Bangabandhu Sheikh Mujibur Rahman Agricultural University (BSMRAU), Gazipur in aman, 2017. Three OTCs (area 9 m2) were constructed with iron frame that installed on the ground according to Uprety (1998) [12]. The OTC had a frustum at the top of the chamber to deflect air and prevent the reduction of desired CO2. For uniform CO2 circulation, a cylindrical double walled plenum was made around the base of the chamber. The inner side of the plenum having numerous gas outlets or different sizes. The small being nearest to the gas inlet pipe. Blowers were used to distribute CO2 uniformly throughout the plant canopy. The CO2 gas was supplied to the chambers from CO2 gas cylinder (collected from Bangladesh Oxygen Limited) using, a manifold, gas regulators, pressure gauge and underground pipeline with the ambient air using a blower. The air blowers with 12 inch in diameter were fitted at the base of the chamber, which thoroughly mixed the supplied CO2 gas with atmospheric air and blew the gas mixture towards the chamber tunnel. Every OTC had a door for entrance into the chamber to manage the crop properly.
For growing rice plants, 96 pots (size: 24 cm in diameter and 27 cm in height) were filled up with wet soil. Physical and chemical properties of initial soil were determined. The amount of soil per pot was almost 13 kg other than water and blank pot weight was 0.5 kg. After potting, urea, TSP, MoP, gypsum, ZnSO4 were added @ 1.27, 0.715, 0.32, 0.13, 0.026 g pot-1, respectively. BU dhan1 was used as planting material. Thirty-day old seedlings was transplanted on 03 August 2017. Transplanting was done by hand with two seedlings hill-1 pot-1. All the fertilizers except N were applied before transplanting of rice seedlings.
A randomized complete block design with eight replications was used for the experimentation. The treatments comprised of two factors. Factor A consisted of four growing conditions- i. OTCwith eCO2, ii. OTC with iCO2, iii. OTC with aCO2 and iv. open field. Factor B was the timing of N application, viz. i. N1 = 1/3rd N at ET + 1/3rd at AT + 1/3rd before PI stage, ii. N2 = 1/3rd N at ET + 1/3rd before PI + 1/3rd at booting stage, and iii. N2 = 1/3rd N at ET + 1/3rd before PI + 1/3rd at flowering stage.
The CO2 gas was supplied to the OTC chambers from CO2 gas cylinder using a blower from 7 days after transplanting to physiological maturity of rice crop. A portable photosynthesis system (model: LICOR 6200, Lincoln, Nebraska) was used to determine the CO2 concentration inside the OTC regularly. In eCO2 treatment, the CO2 concentration fluctuated from 490 to 510 ppm while it was 440 to 460 ppm in case of iCO2. The pots were irrigated after transplanting of rice seedlings. A floodwater depth of 2-3 cm was maintained in each pot until a week before maturity of the crop. Other intercultural operations were done uniformly in each pot to ensure normal growth of the crop.
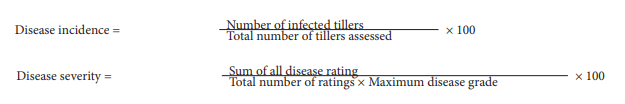
Each pot was visited regularly for recording plant diseases and their incidence and severity. The disease incidence and severity were recorded till maturity stage of rice. Data were recorded visually by observing the prominent symptoms and confirmed the disease and their causal organism through in vitro assessment. The number of tillers hill-1 and number of diseased tillers hill-1 were considered for data collection. Disease severity was estimated according to the Table 1. Finally, the disease incidence and severity were calculated by the following formula (Rajput and Bartaria, 1995):
Gathered data were statistically analyzed using computer software package CropStat, version 7.2 (IRRI, 2007) [13]. Analysis of variance of the data was calculated and the significance of the factor (growing condition and timing of N application) was tested at the 5% level of probability. Treatment means were separated with least significant difference test (LSD) at 5% level of probability (Gomez and Gomez, 1984) [14].
Results and Discussion
Rainfall data were collected from the weather station of BSMRAU. Rainfalls were measured by using rain gauge meter (Figure 1). The experimental site has sub-tropical climate and rainy season started in the month of May and ended in October.
Unfortunately, during the experimental year, the rainy season finished in the month of September. So, there was little rainfall in the month of October (Figure 1). About 70 mm rainfall was recorded at first week of September and similar amounts of rainfall were also recorded at the end of this month.
Maximum and minimum temperature data inside as well as outside the OTC were taken manually every day (Table 2). Daily temperature was measured by using a thermometer (Zeal max. min. thermometer). The temperature was higher inside OTC than open field condition. In the month of September, the temperature under eCO2 condition ranged from 30.1 to 31.7oC, where it was 29.7 to 30.5oC under iCO2 condition and 28.0 to29.0oC under open field condition (Table 2).
Disease incidence
The highest rice sheath blight disease incidence was observed with eCO2 condition with N application up to PI stage of rice (Table 3). In eCO2 condition, the incidence of sheath blight disease was 49.52% when N applied up to PI. Similarly, incidence of sheath blight disease was 30.78 and 37.89% when N applied up to booting and flowering stage, respectively. This implied that application of N at booting and flowering stage of rice reduced the disease occurrence. The incidences of sheath blight were 14.38, 15.68 and 17.36% in case of iCO2, aCO2 and open field, respectively. The results indicated the disease occurrence was much higher with eCO2 condition than with other growing conditions. Augmented CO2 generally produced larger plants with more and/or larger organs, while warmer temperatures accelerated the rate of organ development and expansion but decreased organ life time. Elevated CO2 influences the pathogenicity, host-pathogen interaction and epidemiology of fungal diseases. Temperature is one of the main factors in conjunction with the rain to determine the incidence of disease. Boland et al. (2004) [15] also reported that stress of drier and warmer growing conditions increases the severity of different diseases of maize caused by fungi. Kobayashi et al. (2006) [16] found increased incidence of rice sheath blight caused by Rhizoctonia solani at the eCO2 than aCO2 level.
Disease severity
Like sheath blight incidence, the severity was also maximum with eCO2 in all N management practices (Table 4). However, the severity percentage was 57.20 with eCO2 condition, which became half in iCO2 condition. The severity of plant diseases mediated through changes in the host physiology and morphology (Dwivedi et al., 2017) [2]. Rice plants grown in an eCO2 concentration were more susceptible to sheath blight than those in aCO2. Plants grown with eCO2 concentration had lower leaf silicon content, which may have contributed to the increased susceptibility to sheath blight with eCO2 concentrations. For naturally occurring epidemics of the sheath blight disease development in rice plants, the percentage of diseased plants was higher with eCO2 as opposed to aCO2 concentrations. One hypothesis is that the higher number of tillers observed with eCO2 concentrations may have increased the chance for fungal sclerotia to adhere to the leaf sheath at the water surface. Moreover, microclimate changes based on crop growth stage and plant population densities (Singh et al., 2012) [17]. Consequently, the potential risks for epidemics of sheath blight would increase in rice grown with eCO2 concentration (Kobayashi et al., 2006)[16].
Effect of CO2 on rice disease
With eCO2 condition, the sheath blight disease severity was increased by 216% over control (open air) treatment. But severities were 64% and 27% with iCO2 and aCO2, respectively (Figure 2). The CO2 is one of the most important factors for influencing the host and pathogen growth and development. It has a positive correlation among CO2, plant and pathogen. When the level of CO2 raises the growth and development of pathogen accelerated. In the meantime, plant physiology and structure for instance quantity of nutrients and canopy become changing more rapidly. Higher level of CO2 concentration increases temperature level and diminish the quantity of silicon in rice plant. As a result, plant become more susceptible and enhance disease infestation (Kobayashi et al., 2006) [16,18].
Conclusion
The result of this study disclosed that the highest incidence and severity of rice sheath blight was recorded with the rice plants exposed to elevated CO2 conditions. However, the application of N up to flowering stage of rice reduced the incidence of rice sheath blight substantially with elevated CO2 condition. There has been only limited research on impact of climate change on plant diseases under field conditions or disease management under climate change. Such kinds of study, will provide a new sight to crop improvement program for the development of more resilient rice varieties for the geo-graphical region where rice is the major food crop and highly vulnerable to changing climatic conditions.
Acknowledgement
We are grateful to Krishi Gobeshona Foundation of Bangladesh Agricultural Research Council, for funding this research through CRP-II project.
References
- IPCC (2013) Intergovernmental Panel on Climate Change. The physical science basis, final draft underlying scientific technical assessment. Intergovernmental panel on climate change. In: Fifth Assessment Report on Climate Change 2013. Working Group 1. IPCC Secretariat, Geneva 2, Switzerland.
- Dwivedi SK, Kumar S, Kumar R, Prakash V, Rao KK, et al. (2017) Interactive Effect of Elevated CO2 and Temperature on the Incidence of Brown Spot and Sheath Blight of Rice (Oryza sativa L.). International Journal of Current Microbiology and Applied Sciences 6: 195-202.
- Prakash V, Mishra JS, Kumar R, Kumar R, Kumar S, et al. (2017) Thermal utilization and heat use efficiency of sorghum cultivars in middle Indo-Gangetic Plains. Journal of Agrometeorology 19: 29-33.
- IPCC (2007) Intergovernmental Panel on Climate Change, Climate Change, The Fourth IPCC Assessment Report, Cambridge University Press, Cambridge, UK.
- Oerke EC, Dehne HW, Schonbeck F, Weber A (1994) Crop production and crop protection: estimated losses in major food and cash crops, Amsterdam Elsevier.
- BRRI (2020) Bangladesh Rice Research Institute. “Adhunik Daner Chas” in Bangla, 20th edi. Pp. 20-21.
- Kumar KVK, Reddy MS, Kloepper JW, Lawrence KS, Groth DE, et al. (2009) Sheath blight disease of rice (Oryza sativa L.): An overview. Bioscience and Biotechnological Research in Asia 6: 465- 480.
- Jemberu T, Togashi M, Urayama H (2015) Nitrogen Fertilizer Application Timing on Growth and Yield of NERICA 4 and Japanese Rice Variety Toyohatamochi. International Research Journal of Agricultural Science and Soil Science 5: 91-7.
- Brook SA (2007) Sensitivity to a phytotoxin from Rhizoctonia solani correlates with sheath blight susceptibility in rice. Phytopathology 97: 1207-12.
- Wu W, Huang J, Cui K, Nie N, Wang Q (2012) Sheath blight reduces stem breaking resistance and increase lodging susceptibility of rice plant. Field Crops Research 128: 101-8.
- Miah MAM, Gaihre YK, Hunter G, Singh U, Hossain SA (2016) Fertilizer deep placement increases rice production: Evidence from farmers’ fields in southern Bangladesh. Agronomy Journal 108: 805-8.
- Uprety DC (1998) Carbon dioxide enrichment technology, open top chamber: new tool for global climate research. Journal of Sciences in Indian Research 57: 266-70.
- IRRI (2007) International Rice Research Institute. Crop Stat, version 7.2. Biometric unit of International Rice Research Institute, Philippines.
- Gomez KA, Gomez AA (1984) Statistical procedure for agricultural research (2nd Edn). John Willey and Sons, Singapore.
- Boland G, Melzer M, Hopkin A, Higgins V, Nassuth A (2004) Climate change and plant diseases in Ontario. Canadian Journal of Plant Pathology 26: 335-50.
- Kobayashi T, Ishiguro K, Nakajima T, Kim H, Okada M, et al. (2006) Effects of elevated atmospheric CO2 concentration on the infection of rice blast and sheath blight. Phytopathology 96: 425-31.
- Singh SP, Sandhu SK, Dhaliwal LK, Singh I (2012) Effect of planting geometry on microclimate, growth and yield of mungbean (Vigna radiata L.). Journal of Agricultural Physics 12: 70-3.
- Rajput RL, Bartaria AM (1995) Reaction of rice cultivars to brown spot. Agricultural Science Digest Journal 15: 205-6.
Artcle Information
Review Article
Received Date: January 07, 2025
Accepted Date: January 24, 2025
Published Date: January 31, 2025
Journal of Plant Biology and Agronomy
Volume 1 | Issue 1
Citation
Rahman MS, Mamun MAAA, Miah MMU, Haque MM, Rahman MM, et al. (2025) Incidence and Severity of Rice Sheath Blight Disease under Elevated Carbon Dioxide and Nitrogen Management. J Plant Biol Agron 1: 101
Copyright
©2025 Mamun MAAA. This is an open-access article distributed under the terms of the Creative Commons Attribution License, which permits unrestricted use, distribution, and reproduction in any medium, provided the original author and source are credited.

doi: jpba.2025.1.101