

Review Article
Volume-1 Issue-1, 2025
Analysis on Household Benefits of Cocoa Rehabilitation and Regression in Liberia Cocoa Belt
-
Received Date: March 04, 2025
-
Accepted Date: March 21, 2025
-
Published Date: March 29, 2025
Journal Information
Abstract
The status of smallholder cocoa farms in Liberia's cocoa belt is investigated in the present study (Bong, Lofa, and Nimba Counties). Furthermore, the first part of the study focused on a household survey among cocoa farmers, with the results published in a separate report in 2016, and the second part of the study focused on road rehabilitation, cocoa marketing, and the state of cocoa farms. Farmers reported that the quality of their cocoa farms had improved slightly. Farm management practices remain at a basic level, resulting in low productivity (e.g., everyday input use and the predominance of local cocoa varieties). On cocoa farms, pests and diseases such as rodents and black pod disease are common
In terms of cocoa production and income, there are significant regional differences, with Lofa farmers producing and earning the least compared to other cocoa farmers in Bong and Nimba Counties. Cocoa farm rehabilitation appears to be more closely linked to cocoa income than cocoa production. The effects of cocoa rehabilitation that can be seen are still inconclusive. Cocoa production and revenue have increased since the baseline study, and this is true for both participants and non-participants in cocoa rehabilitation projects. The value of a household's goods and assets has no strong relationship with cocoa rehabilitation or cocoa revenues. These outcomes at the household level are strongly linked to household characteristics (gender and head of household, household size, and permanent illness within the household). According to a study on household food security and cocoa income, cocoa rehabilitation could indirectly contribute to food security. Secondary and primary roads in Lofa County, Guatemala, are being repaired, which helps people have enough food to eat.
The findings show that cocoa farm conditions need to be improved; cocoa practices are still at a basic level, so more investment is needed to make significant changes in Liberia's cocoa sector. It is not so much a question of whether or not farmers are interested in cocoa rehabilitation, but rather whether or not they are aware of and eligible for assistance.
Key words
Cocoa Rehabilitation; Regression Models; Bong; Lofa; Nimba; Liberia
|
Bong |
Lofa |
Nimba |
P-value |
Area (ha) – measured with GPS |
0.62 |
1.07 |
1.19 |
0.0000a |
Cocoa trees |
1168 |
1984 |
2672 |
0.0063a |
Cocoa trees per ha |
1318 c |
1997 c |
2392 c |
0.0000a |
Average age of cocoa trees |
38.6 |
30.6 |
29.0 |
0.0000a |
% respondents doing under brushing |
92% |
95% |
96% |
0.4091 b |
Frequency under brushing (2016) |
1.54 c |
4.92 c |
2.00 c |
0.3087a |
% respondents doing regeneration with |
14% |
12% |
6% |
0.6269 b |
Trees regenerated chupon (2016) |
19.2 |
32.2 |
18.2 |
0.6269a |
% respondents replanting in 2016 (yes/ |
49% |
41% |
68% |
0.0001b |
Almelonado seedlings 2016 |
69.3 |
83.2 |
151.9 |
0.0022a |
Amazon seedlings 2016 |
45.8 |
41.1 |
153.9 |
0.0126a |
Hybrid seedlings 2016 |
117.5 |
333.4 |
848.2 |
0.1142a |
a P-value of ANOVA test to determine whether differences in means between counties are significant.
b P-value of Kruskal-Wallis ranking test to determine whether differences in frequencies between counties are significant.
c After removal of outliers
|
Semi-abandoned |
Basic revitalization |
Enhanced revitalization |
P-value |
Trees per ha |
2264c |
1463c |
1750 |
0.0002a |
Average age of cocoa trees |
33.2 |
32.9 |
22.5 |
0.0000 a |
% almelonado |
45 % |
49 % |
26 % |
0.0000 a |
% amazon |
26 % |
21 % |
41 % |
0.0000 a |
% hybrid (Ghana) |
19 % |
27 % |
20 % |
0.0000 a |
Under brushing (times per |
1.5c |
1.9c |
1.8 c |
0.0000a |
Replanting (yes/no) |
41 % |
59 % |
43 % |
0.0001b |
Almelonado trees replanted |
141.7 |
94.2 |
45.6 |
0.0780 a |
Amazon trees replanted |
111.4 |
83.4 |
39.0 |
0.7063 a |
Hybrid trees replanted |
296.8 |
768.1 |
459.6 |
0.4355 a |
No inputs |
95 % |
90 % |
92 % |
0.1472b |
Organic fertilizers |
0 % |
0 % |
0 % |
0.9992b |
Chemical fertilizers |
2 % |
3 % |
0 % |
0.8046b |
Pesticides |
1 % |
5 % |
5 % |
0.3081b |
Fungicides |
1% |
5% |
5% |
0.2618b |
Herbicides |
0% |
1% |
0% |
0.9713b |
Pods harvested per tree in 2016 |
19.4 |
20.2 |
17.2 |
0.4603 a |
Pods on treat time of survey |
9.6 |
7.7 |
8.8 |
0.0019 a |
Cocoa yield in 2016 (kg per |
313c |
309c |
284c |
0.8232 a |
Cocoa yield in 2016 (kg per |
0.13c |
0.23c |
0.23c |
0.0014 a |
Dry cocoa sold in 2016 (kg) |
130.9 |
155.2 |
103.4 |
0.0003 a |
Dry cocoa sold in 2016 (kg per |
222.9c |
213.9c |
190.7c |
0.5349 a |
Grade 1 cocoa sold in 2016 |
119.2 |
84.9 |
15.0 |
0.0174 a |
Grade 1 cocoa sold in 2016 (kg |
153.4 c |
84.2 c |
7.4 c |
0.0034 a |
aP-value of ANOVA test to determine whether differences in means between counties are significant.
bP-value of Kruskal-Wallis ranking test to determine whether differences in frequencies between counties are significant.
c after removal of outliers
% Trees affected |
Semi- abandoned |
Basic revitalization |
Enhanced revitalization |
P-valuea |
No pests |
10 % |
12 % |
10 % |
0.0214 |
Rodents |
45 % |
46 % |
14 % |
0.0001 |
Groundhog |
12 % |
12 % |
3 % |
0.0027 |
Black pod disease |
81 % |
76 % |
73 % |
0.0001 |
CSSV |
12 % |
15 % |
5 % |
0.0001 |
Other |
7 % |
4 % |
1 % |
0.3155 |
Significance levels (p): * < 0.1; ** < 0.05; *** < 0.01
|
Bong |
Lofa |
Nimba |
P-value |
STCRSP |
1.3 % |
27.6 % |
1.5 % |
0.0001 |
LIFE |
6.6 % |
13.6 % |
1.6 % |
0.0003 |
LAADCO |
0.0 % |
3.6 % |
0.3 % |
0.4073 |
WIENCO |
5.0 % |
3.5 % |
2.5 % |
0.7202 |
SOCODEVI |
17.5 % |
1.1 % |
17.2 % |
0.0001 |
STCP |
1.5 % |
3.1 % |
1.1 % |
0.7748 |
Cooperative |
2.9 % |
13.1 % |
1.6 % |
0.0002 |
Other |
1.2 % |
1.5 % |
0.3 % |
0.9150 |
Assistance (yes/no) |
31.1 % |
41.9 % |
22.9 % |
0.0001 |
Significance levels (p): * < 0.1; ** < 0.05; *** < 0.01
|
Bong |
Lofa |
Nimba |
P-value |
Farmers’motivationtoparticipateincocoarehabilitationprojects(%respondents) |
||||
Was invited to participate |
18.2 % |
32.5 % |
14.4 % |
0.0085 |
Was told to participate |
8.8 % |
27.4 % |
3.8 % |
0.0003 |
Want to increase income |
82.4 % |
78.5 % |
71.2 % |
0.3031 |
Want to receive training and inputs |
72.3 % |
47.3 % |
40.4 % |
0.0001 |
other |
10.7 % |
3.4 % |
0.0 % |
0.2854 |
Farmers’reasonsfornotparticipatingincocoarehabilitationprojects(%respondents) |
||||
Did not know |
72.2 % |
57.6 % |
68.4 % |
0.0010 |
Was not selected |
26.6 % |
49.4 % |
32.0 % |
0.0001 |
Did not expect any benefits |
0.0 % |
1.8 % |
2.4 % |
0.8104 |
Cocoa not important for income |
0.2 % |
0.8 % |
0.6 % |
0.9909 |
No time / labour available |
3.6 % |
8.3 % |
1.6 % |
0.2284 |
Other |
9.1 % |
1.3 % |
2.8 % |
0.1200 |
Significance levels (p): * < 0.1; ** < 0.05; *** < 0.01
|
2013 |
2014 |
2015 |
2016 |
Lofa |
-95.2*** |
-81.0*** |
-79.1*** |
-10.0 |
Nimba |
41.5** |
48.4*** |
77.0*** |
34.2*** |
Rehabilitation (y/n) |
23.7* |
30.7** |
20.8 |
5.7 |
Farm status 2012 |
2.4 |
6.8 |
-7.3 |
-4.5 |
Farm size (ha) |
24.2*** |
24.5*** |
34.1*** |
10.8*** |
Variety: hybrid (% trees) |
-25.8 |
-17.2 |
35.0 |
-14.4* |
Pests: rodents (% trees) |
-9.1 |
2.0 |
-0.5 |
-21.1*** |
Pests: groundhog (% trees) |
4.5 |
1.1 |
-9.1 |
22.4** |
Pests: black pod disease (% trees) |
43.8*** |
38.0** |
56.9*** |
-11.6 |
Pests: CSSV (% trees) |
6.3 |
9.2 |
-11.0 |
-5.0 |
Buyer: trader (y/n) |
16.6 |
14.6 |
-33.9** |
15.1* |
Buyer: coop (y/n) |
45.7*** |
40.4** |
11.0 |
128.3*** |
Buyer: WIENCO (y/n) |
105.7* |
54.2 |
103.1** |
157.4*** |
constant |
132.9*** |
131.3*** |
170.1*** |
41.2*** |
Prob > F |
0.0000 |
0.0000 |
0.0000 |
0.0000 |
Adj R-squared |
0.1517 |
0.12078 |
0.1591 |
0.2168 |
N |
902 |
1018 |
1149 |
1638 |
Significance levels (p): * < 0.1; ** < 0.05; *** < 0.01
|
2013 |
2014 |
2015 |
2016 |
Cocoa production (kg) |
0.6*** |
0.6*** |
0.8*** |
0.8*** |
Lofa |
-77.4*** |
-64.6*** |
-40.2** |
-78.4*** |
Nimba |
-86.7*** |
-52.8*** |
-15.0 |
4.1 |
Rehabilitation (y/n) |
6.2 |
12.8 |
29.3** |
24.1** |
Farm status 2012 |
-5.0 |
-15.0* |
-9.1 |
0.4 |
Buyer: trader (y/n) |
-5.8 |
0.8 |
14.4 |
82.3*** |
Buyer: coop (y/n) |
11.6 |
32.6** |
29.7 |
17.8 |
Buyer: WIENCO (y/n) |
109.2*** |
134.1*** |
141.6* |
73.1** |
CAR improvement (y/n) |
14.6 |
3.1 |
-0.4 |
-5.7 |
Secondary road improvement (y/n) |
-19.1 |
-24.7 |
-25.3 |
-16.5 |
Primary road improvement (y/n) |
-16.6 |
-12.2 |
-12.5 |
33.6** |
Constant |
132.4*** |
154.0 *** |
112.6*** |
97.3*** |
Prob > F |
0.0000 |
0.0000 |
0.0000 |
0.0000 |
Adj R-squared |
0.3840 |
0.2932 |
0.3698 |
0.2523 |
N |
707 |
841 |
1031 |
1479 |
Significance levels (p): * < 0.1; ** < 0.05; *** < 0.01
|
Value of household |
Value of all assets (USD) |
Food security (meals/yr) |
Lofa |
7.20*** |
-8.90 |
25.4* |
Nimba |
5.72*** |
16.05* |
80.4*** |
Cocoa income in last 4 years |
-0.00** |
0.00 |
0.01** |
Cocoa rehabilitation (y/n) |
1.17 |
-0.28 |
-2.47 |
Male head of household (y/n) |
3.57* |
21.82*** |
26.76* |
Education level head of household |
2.95*** |
4.52* |
-1.63 |
Household size |
0.63*** |
4.67*** |
-0.43 |
Age head of household |
0.02 |
-0.09 |
0.01 |
Number of HH members with illness |
-1.83* |
-16.74*** |
-11.87 |
Total farm plots |
0.58 |
0.31 |
9.79*** |
CAR improvement (y/n) |
-0.27 |
0.11 |
11.81 |
Secondary road improvement (y/n) |
0.90 |
1.68 |
7.04 |
Primary road improvement (y/n) |
-2.18 |
-18.13 |
12.23 |
Travel time to district market (min) |
-0.02* |
0.06 |
-0.05 |
Constant |
4.59 |
32.03 |
535.78*** |
Prob > F |
0.0000 |
0.0000 |
0.0000 |
Adj R-squared |
0.0815 |
0.0876 |
0.0630 |
N |
1240 |
832 |
1474 |
Significance levels (p): * < 0.1; ** < 0.05; *** < 0.01
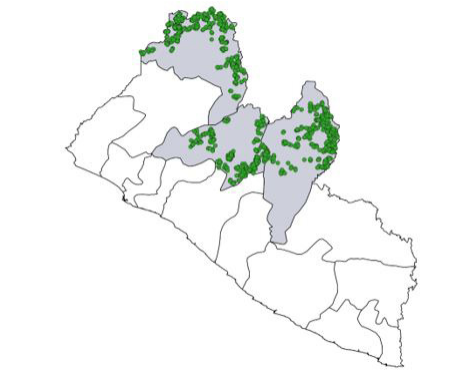 |
| Figure 1: Locations of the cocoa farms included in the survey |
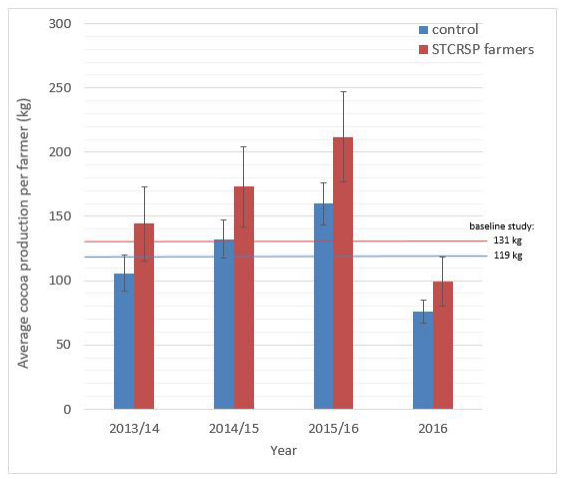 |
| Figure 2: Average cocoa production per farmer, with 95 % confidence intervals |
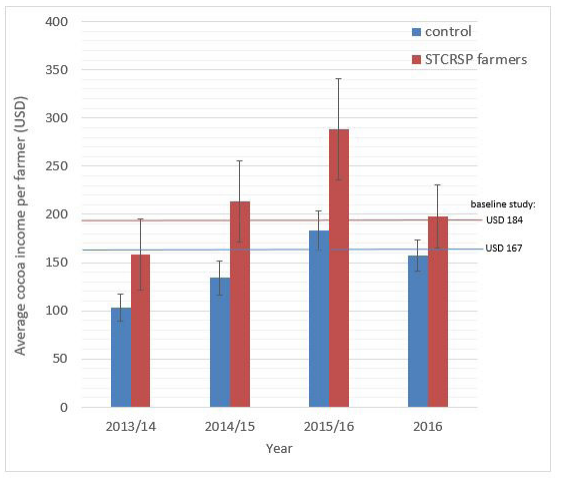 |
| Figure 3: Average cocoa income per farmer, with 95 % confidence intervals |
Introduction
Cocoa (Theobroma cacao L) is a significant cash crop source for many smallholder farmers in the forest regions of Liberia. Ninety percent of worldwide cocoa production comes from smallholdings [1], and most of this production occurs in areas of high biodiversity. As a tropical rainforest country endowed with about 50 % of West Africa's natural rainforest, Liberia continues to have a growing number of cocoa farms, especially in the form of smallholder farming. Even though these smallholder cocoa farms continue to be a source of livelihood for many rural households, productivity remains constrained by factors such as the aging of trees, poor statuses of farms, inappropriate agronomic practices [4]. However, in recent years, many institutions, including IFAD, USAID, World Bank, have intervened with supports such as rehabilitating existing farms in major cocoa belts in Liberia, expecting to improve productivity. The government of Liberia (GOL) has also expressed high priorities in improving smallholder cocoa farms in Liberia. For instance, based on achievements and lessons learned from the IFAD co-financed Smallholder Tree Crop Revitalization Support Project (STCRSP) in Lofa County, GOL, through the Ministry of Agriculture (MOA), has requested extension projects to support the smallholder cocoa and coffee subsectors, to improve the livelihoods and climate change resilience of rural households [5].
Increased cocoa production must sustain institutional efforts such as the cocoa rehabilitation program and improved chupon regeneration. Although cocoa accounts for less than 5 % of Liberia's export earnings, it employs some 10,000 households [5]. Liberia's agricultural sector has contributed immensely to rural development, industrial materials, food security, and consciousness of measures to increase cocoa production, which accounted for a significant contribution to the national export, improved standard of living, and poverty reduction [2]. For sustainable food production and balance of payment surplus, the Liberian government has acknowledged issues of the improvement of the cocoa sector instead of depending solely on rubber production for national development by embarking on institutional efforts, such as the Central Agricultural Research Institute (CARI), cocoa rehabilitation techniques, and among others [3].
The primary goal of this study was to assess the state of smallholder cocoa farms in Liberia's cocoa belt (Bong, Lofa, and Nimba Counties). The first phase of the research was completed in 2016, and it was based on a household survey of cocoa farmers [8]. A second survey was conducted in November and December 2016 to gather data on road rehabilitation, cocoa marketing, and farm data. Enumerators visited the cocoa farms of the respondents and re-interviewed the same cocoa farmers who had been interviewed during the household survey. As a result, improving livelihoods in rural areas where agriculture is dominant is critical to attracting displaced Liberians back home. Liberia, which was ranked forty-fourth out of fifty countries on the United Nations Conference on Trade and Development's (UNCTAD) list of least developed countries in 2005, is recovering from the world's largest GDP decline (91 %) since World War II [7]. The challenge is immense, with an estimated 85 % of the population unemployed, 80 % of the population living in poverty, and a GDP of $500 in purchasing power parity terms Eriksson [3].
According to Lujala P., Hooper, A., & Purcell, M. J. (2021) [6], the initial income stage, the rate of monetary increase, and the shape of export markets are the major economic factors that contribute to the risk of conflict. Liberia's government aims to achieve this goal by providing financial and technical assistance to rehabilitate smallholder farms and increase production [4].
Farms fellow at some point during the conflict due to a lack of options for harvesting and selling cocoa. Unlike "slaughter tapped" rubber, today's cocoa inventory is still economically viable. Farms should undoubtedly improve because cocoa has a long productive lifespan, peaking at around 40 to 50 years and producing for decades [9]. The success of cocoa as a source of income for smallholder farmers in rural areas is contingent on market reforms and increased manufacturing capacity. Policymakers need to know about the factors that affect cocoa marketing in Liberia, as well as the factors that affect cocoa marketing in other countries. This will help them separate Liberia from its peers and cocoa from other important tree species.
Materials and Methods
Our research used data from Bong, Lofa, and Nimba counties, as well as a multistage random sampling technique. Out of the ten (LCAs) producing cocoa areas in the country, we purposefully selected three local cocoa areas (LCAs) at random from the cocoa region known for high cocoa production. A structured questionnaire was used to collect the data. The information gathered includes the respondents' socioeconomic characteristics, their level of awareness of cocoa rehabilitation techniques, extension visits, and their level of adoption of cocoa rehabilitation techniques, among other things. The number of strategies that the farmers were aware of after adoption was divided into low, medium, and high adoption levels to determine the level of understanding and adoption. Adoption of no more than two techniques was deemed insufficient; three to four techniques were deemed medium; and more than five techniques were deemed high [3]. Figure 1 shows the locations of the cocoa farms those enumerators who work for the Central Agricultural Research Institute visit.
Benefits to Households from Cocoa Rehabilitation
Statistical reference tools such as the correlation coefficient and multiple regressions were used to analyze the data. To quantify the strength of the relationship between a dependent variable (Y) and a number of independent explanatory variables, we used multiple regression models (X). The multivariate regression model evaluates causal inferences, i.e., which explanatory variables have a significant relationship with the dependent variable and which do not. When we fit dependent variables against multiple explanatory variables, we can see how each variable contributes to the variation in the dependent variable when the other explanatory variables are equal.
The following are the regression models:
Yi = 0 + 1xi1 + 2xi2 + zxiz + i
Where Yi is the dependent variable (e.g., cocoa production or income), Xi is a vector of independent explanatory variables (e.g., county, cocoa rehabilitation, farm size, pests, or buyers), j are the estimated coefficients and i is the error term. Ordinary Least Squares regression models were used to estimate the regression models (OLS). Given the other explanatory variables in the model, the zero hypothesis states that the explanatory variable Xi is not associated with the dependent variable Y (thus j = 0).
Results and Discussion
Productivity on cocoa farms
According to area measurements, the average size of the cocoa farms is about one hectare, though the farms in Bong were significantly smaller (0.6 ha) than those in Lofa (1.1 ha) and Nimba (1.2 ha) (1.2 ha). Most farmers have no idea how many cocoa trees they have on their property. According to the estimates of a small group of farmers, farmers in Nimba have the most trees, while farmers in Bong have the fewest (Table 1). Similarly, Nimba's cocoa farms have the highest tree density, while Bong's has the lowest. However, it is unknown how accurate the farmers' estimates of the number of trees are because the majority of respondents (94 %) underbrush their cocoa farms. Over half of respondents (53 %) replanted trees in 2016, with Nimba County (68 %) having a significantly higher percentage of respondents (68 %) than Bong County (49 %) and Lofa County (49 %). (42 %) Farmers in Nimba mostly plant hybrid varieties (from Ghana), but they also replant local varieties (Table 1). A small number of farmers (11 %) use coupon grafting to grow cocoa again.
Enumerators' visits to cocoa farms and the number of cocoa trees per hectare
In November and December 2016, enumerators visited cocoa farms to assess productivity by collecting data on ten randomly selected trees. Because of the small sample size, findings in this category should be interpreted with caution. Ten farms were rated at the highest level (restocking). It is possible that respondents and enumerators chose this category by accident or misunderstood the description. As a result, observations for farms classified as "restocking" were left out of the analysis.
Farmers who rate their farm as semi-abandoned have a significantly higher estimated number of trees per ha than farmers who have revitalized their farms. The replanting of cocoa trees is where the differences between the various levels of farm rehabilitation are most visible (Table 2). In 2016, the majority of farmers who rated their farms as needing basic revitalization (59 percent) planted trees, particularly hybrid varieties. Farmers also underbrush their farms more often than their peers, who label them as "semi-abandoned" due to no significant differences in input use (92 percent of farmers are not using any inputs for cocoa). Estimated cocoa yields per hectare (on average 0.3 MT per hectare) do not differ significantly between farm rehabilitation levels. Farmers with semi-abandoned farms said they sold more grade 1 cocoa than farmers who had their farms restored (Table 2).
Cocoa Farm Pests and Diseases
Pests and diseases, particularly black pod disease and rodents, continue to be a problem in cocoa farming. Respondents who had cocoa farms that had been improved had less pests and diseases than other farmers (Table 3).
Participates in Cocoa Rehabilitation Projects
Around a third of all respondents took part in external interventions to rehabilitate cocoa farms; the percentage of participants in Lofa County (42 %) was significantly higher than in Bong County (31%), and Nimba County (12 %). (23 %). Cocoa farmers in Lofa County were mostly helped by the STCRSP project, LIFE project, and cocoa cooperatives referencing Bong and Nimba Counties, with the majority of external support provided by SOCODEVI (Table 4). Respondents were also asked about their motivation for taking part in rehabilitation projects.
Farmers joined rehabilitation projects for two reasons: first, to increase their incomes, and second, to receive training and inputs for cocoa production. A large percentage of farmers in Lofa County said they were approached to participate. The majority of those who did not participate said they were unaware of any rehabilitation projects, with Bong and Nimba counties having significantly higher percentages of respondents mentioning this than Lofa County. About half of those who did not participate in the survey in Lofa County (49 %) said they were not chosen for the project. Only a few farmers gave specific reasons for their lack of participation, such as no expected benefits or a lack of time (Table 5).
Regression Models on Cocoa Production and Income in the Cocoa Belt
Cocoa production was regressed on a list of variables that typically influence the level of production (estimated as total dry cocoa per year in kg) (Table 6). The findings reveal significant regional differences: cocoa production in Nimba County is consistently higher, while output in Lofa County is consistently lower (except for 2016). The estimates of comparisons between a treatment (beneficiaries of rehabilitation projects) and a control group may have been skewed because of this regional effect (nonbeneficiaries). Participation in a rehabilitation project is linked to increased cocoa production, though the link is not as strong as it is with other variables. Given that the correlation is positive across all years, it is difficult to conclude that rehabilitation leads to increased output. It is also possible that farmers who produce more cocoa are more interested in (or eligible for) cocoa rehabilitation than those who produce less cocoa.
Farm size has a strong relationship with cocoa production, but the proportion of different cocoa varieties (as measured in 2016) does not appear to have an impact. The farm's status in 2012 (as determined by the farmer) had no bearing on cocoa production. Pest and disease effects are also limited, possibly because most cocoa farms are infected. In 2016, mice had a significant negative impact on cocoa production. Although black pod diseases were found to be linked to cocoa production, it is possible that farmers who produce more cocoa are more aware of the disease. Cooperatives and WIENCO, for example, have a positive correlation with cocoa production because they provide farmers with advice, inputs, and guaranteed markets. These buyers, on the other hand, may be looking for farmers who produce more cocoa than their peers.
Revenues from cocoa Farming in the Cocoa Belt
Cocoa production is extremely reliant on revenue. However, there is a strong regional effect that influences annual cocoa revenues, with farmers in Lofa County earning significantly less than their counterparts in other Counties. In 2013 and 2014, Nimba farmers earned less money, but this effect faded in 2015 and 2016. Cocoa revenues and farm rehabilitation are both positively correlated with farm size. Farmers who sell to WIENCO (or cooperatives in 2014 and 2016) appear to make more money from cocoa than those who sell to traders (Table 7). Only in 2016 did cocoa rehabilitation have a positive correlation with cocoa revenues. Except for changes to primary roads in 2016, road improvements had no effect on cocoa income. Because there is often a lag between interventions and changes in outcomes, it is possible that the benefits of cocoa rehabilitation and road improvements will only be realized after 2016. However, caution should be exercised because the 2016 cocoa production and income estimates were gathered halfway through the harvesting season. It is possible that estimates for the entire 2016/2017 cocoa season will differ slightly.
The Value of all Assets and Household Goods (Household Equipment)
Household characteristics such as gender of the head (femaleheaded households own fewer assets), education level of the household head, and household size are strongly associated with the value of household goods (household equipment) and all assets (total value of household goods, farm tools, and livestock) (Table 8). Illnesses that affect household members' ability to study and work have a significant negative impact on goods and assets. Over the last four years, total cocoa income has been negatively correlated with the value of household goods; this is difficult to explain, but other confounding factors, such as higher-revenue income activities, could be at play. The value of household goods is higher in Lofa and Nimba Counties than in Bong County, indicating regional effects. Families who live further away from district markets have more miniature household items. Food security (estimated annual meals) is linked to cocoa income, the head of household's gender (male-headed households are more food secure), and the number of farm plots. The most foodsafe households are in Nimba County, while the least food-safe households are in Bong County.
Key Indicators are compared to the Baseline Study
In 2014, a baseline study was conducted in Lofa County to measure key indicators in the research and non-research communities at the household level. Furthermore, the 2016 survey was conducted independently of the baseline survey, with a different questionnaire and sampling strategy but vital indicators where possible. At baseline (February 2014), the average cocoa production (kg per farmer) for the research and non-research communities was estimated at 131.2kg and 119.5kg, respectively. Over the following seasons, the average cocoa production per farmer (estimates based on farmers' recall) increased. In the 2014/15 and 2015/16 seasons, STCSP farmers produced significantly more cocoa than baseline farmers (Figure 2). The same conclusion was reached for nonSTCRSP farmers, with the certainty that this was due to the STCRSP intervention. Because this was measured in the middle of the season, the production for 2016/17 is significantly lower. STCRSP farmers, on the other hand, had similar revenues in the 2013/14 and 2014/15 seasons compared to the baseline study, but significantly higher revenues in the 2015/16 season compared to the baseline study. Cocoa revenues for non-STCRSP farmers were significantly lower in the 2013/14 and 2014/15 seasons than in the baseline study. Cocoa revenues in 2015/16, on the other hand, were comparable to payments measured at baseline (Figure 3). There has been no improvement in terms of pests or input use. According to the baseline study, 95 % of non-project farmers lacked access to extension services. In 2016, 73 % of non-STCRSP farmers lacked access to extension services. It is possible that the difference in access between 2014 and 2016 is due to a different sampling strategy. There was no discernible difference in project beneficiaries' access to extension.
Conclusions
We conducted a study among cocoa farmers in Liberia's cocoa belt to assess the current situation of cocoa producers in 2016. In June 2016, over 2000 farmers' households' data were collected, and these households were visited again in November 2016 to collect additional information on the cocoa farms and nearby road conditions. Farmers reported a small but significant improvement in the status of their cocoa farms in 2016 compared to 2012.
Farmers received outside help to rehabilitate their farms, with Lofa County having the highest percentage (42 %). Farmers joined rehabilitation projects primarily for two reasons: first, to increase their incomes; and second, to receive training and inputs for cocoa production. The majority of those who did not participate stated that they were unaware of any rehabilitation project or that they were not chosen to participate. It is not so much a question of whether people are interested in cocoa rehabilitation as it is a question of whether farmers are told about and qualify for outside help.
According to the regression models, there are significant regional effects on cocoa production and income, with Lofa farmers producing and earning the least compared to other cocoa farmers in Bong and Nimba Counties. Cocoa farm rehabilitation appears to be more closely linked to cocoa income than cocoa production. Farmers who sell to cooperatives like WIENCO have higher production and income levels. It is important to note, however, that a positive correlation or association does not imply causation. As a result, the effects of cocoa rehabilitation that can be observed are inconclusive. In comparison to the baseline study, cocoa production and income have increased, but this is true for both farmers who have participated in cocoa rehabilitation projects and those who have not.
Acknowledgments
The Central Agricultural Research Institute (CARI) funded this research. Thank you to the anonymous reviewers for their critical comments and suggestions on the manuscript, which they got from the Department of Natural Resources Management.
Conflict of interests
The authors declare no conflict of interest.
References
- Crozier J, Sastroutomo SS, Ngim JCK, Susilo AW, Abdoellah S, et al. (2018) “Cocoasafe”: Capacity Building and Knowledge Sharing in Sps in Cocoa in South East Asia and The Pacific. In International Symposium on Cocoa Research (ISCR), Lima, Peru, 13-17 November 2017. International Cocoa Organization (ICCO)
- Dukuly M USA (2012) Credit participation and access in postwar economy: Evidence from small scale enterprises in Liberia. In African Finance Workshop in South Africa on August 7th and 8th.
- Eriksson Skoog G, et al. (2016) Cocoa in post-conflict Liberia: the role of institutions for the development of inclusive agricultural markets. Nordic Africa Institute.
- Food and Agriculture Organization of the United Nations and Liberian Ministry of Agriculture (FAO/MOA). 2009. Baseline Survey. Food and Agriculture Organization and Liberian Ministry of Agriculture. Monrovia, Liberia.
- Hendriks SL (2018) Review of the Draft Liberia Agricultural Sector Investment Plan (LASIP II) For 2018–2022 with a Focus on Component 4 of the Malabo CAADP Results Framework (No. 1878-2020-478).
- Lujala P, Hooper A, Purcell MJ (2021) The Environmental Spoils of War. In Routledge Handbook of Environmental Security (pp. 115-128). Routledge.
- Radelet S (2007) Reviving economic growth in Liberia. Available at SSRN 1101496.
- Van Hulst FJ, Posthumus H (2016) Understanding (non-) adoption of conservation agriculture in Kenya using the reasoned action approach. Land Use Policy 56: 303-14.
- Ziegleder G (2017) Flavor development in cocoa and chocolate. Beckett's industrial chocolate manufacture and use, 185-215.
Artcle Information
Review Article
Received Date: March 04, 2025
Accepted Date: March 21, 2025
Published Date: March 29, 2025
Journal of Plant Biology and Agronomy
Volume 1 | Issue 1
Citation
David P Tokpah (2025) Analysis on Household Benefits of Cocoa Rehabilitation and Regression in Liberia Cocoa Belt. J Plant Biol Agron 1: 102
Copyright
©2025 David P Tokpah. This is an open-access article distributed under the terms of the Creative Commons Attribution License, which permits unrestricted use, distribution, and reproduction in any medium, provided the original author and source are credited.

doi: jpba.2025.1.102