

Research Article
Volume-1 Issue-1, 2025
Nutritional Status of Children Under 5 Years Associated to Socio-Economic, Demographic and Water, Sanitation and Hygiene Factors in Ndjamena, Chad
Received Date: April 06, 2025
Accepted Date: April 23, 2025
Published Date: April 30, 2025
Journal Information
Abstract
Child malnutrition is a major public health problem in developing countries, which may be prevent through public health development. The present study aimed at determining socio-economic, demographic (SED) and water, hygiene and sanitation factors (WASH) associated with malnutrition among children 0-59 years old in households in the Ndjamena region. A cross sectional study was performed among children 0-59 years in households in the city of N’Djamena from January to June 2020. SED and WASH characteristics were documented from a questionnaire and the anthropometric parameters were collected for calculations of malnutrition indices (weight for height, height for age, and weight for age) and indicators (acute, chronic and underweight). A total of 1248 children under 5 years old of both sexes (male and female) participated in the study. The frequency of acute, chronic and underweight was 6.5%, 30.3% and 13.3%, respectively. The characteristics of the head of the family including the gender, age, and level of education, profession, religion and the size of the household were significantly associated with the nutritional status of the children. Underlying causes of child malnutrition status in NDJAMENA City is a good starting point to initiate proper intervention strategies to decrease the level of malnutrition in childhood, hence the rate of mortality.
Key words
Child Malnutrition; Socioeconomic Factors; Households in the Ndjamena Region
List of abbreviations: SED: Determining Socio-economic, Demographic; WASH: Water, Hygiene And Sanitation Factors; GAM: Global Acute Malnutrition; SAM: Severe Acute Malnutrition; EA: Primary Sampling Units; EAs: Enumeration Areas; ENA: Emergency Nutrition Assessment; SMART: Specific, Measurable, Attainable, Relevant, and Time-Framed; N: Estimated Total Houses; n: Number of Households to be Surveyed; W/H: (weight-for-height); H/A: (height-for-age); W/A: (weight-for-age); RR: Relative Risk; Official P: Official public; Official V: Official Private; CI: Confidence Interval; WHO: World Health Organization
Variables |
Modalités |
Effective (N) |
Percentage (%) |
Gender of household heads |
Male |
802 |
80.1 |
Female |
199 |
19.9 |
|
Age of household heads |
< 45 |
752 |
75.2 |
46-65 |
240 |
24.0 |
|
66 and over |
8 |
0.8 |
|
Marital status |
Married |
93 6 |
93.5 |
Single |
19 |
1.9 |
|
Divorced |
11 |
1.1 |
|
Widower |
35 |
3.0 |
|
Mother's profession |
Housewife |
11 3 |
11.3 |
Official P |
270 |
27.0 |
|
Official V |
237 |
23.7 |
|
Trader |
27 |
2.7 |
|
Breeder / Agriculture |
40 |
4.0 |
|
Others |
314 |
31.3 |
|
Income (fcfa) |
Less than 50 thousands |
194 |
19.4 |
50 -100 thousands |
300 |
30.0 |
|
100 - 200 thousands |
279 |
28.0 |
|
over 200 thousands |
228 |
22.8 |
|
Religions |
Muslim |
781 |
78.3 |
|
Christian |
198 |
19.8 |
|
Others |
19 |
1.90 |
Household size |
≤3 |
210 |
21.0 |
|
4-5 |
388 |
38.8 |
|
6-7 |
230 |
23.0 |
|
8-9 |
98 |
9.8 |
|
≥10 |
73 |
7.3 |
Educational level of household heads |
Out of school |
124 |
12.4 |
Primary |
123 |
12.3 |
|
Secondary |
262 |
26.2 |
|
Higher |
269 |
26.9 |
|
Literate (Koranic school) |
223 |
22.3 |
Official P: public; Official V: private
Table 1: Sociodemographic and economic characteristics of householdsVariables |
Modality |
Number (N) |
Frequency (%) |
Water supply |
Tap / running water |
569 |
56.8 |
|
Public tap / fountain |
109 |
10.9 |
|
Drill / Pump |
320 |
32.0 |
|
Protected water source |
3 |
0.3 |
Presence of Latrine |
Yes |
993 |
99.2 |
|
No |
8 |
0.8 |
Type of Latrines used in the household |
Flushing of water to a septic tank |
99 |
9.9 |
Single hole latrine without slab / floor |
497 |
32.7 |
|
open defecation |
9 |
0.9 |
|
|
Single hole latrine with slab / floor |
396 |
39.6 |
Number of households sharing latrines |
1-3 |
653 |
65.2 |
4-6 |
223 |
22.3 |
|
7-10 |
54 |
5.4 |
|
Over 10 |
71 |
7.1 |
|
Presence of children 3 years |
Yes |
817 |
81.7 |
No |
183 |
18.3 |
|
Method of Elimination of child defecation |
Child uses the latrine |
65 |
7.9 |
Thrown / rinsed in latrines, Buried |
675 |
82.4 |
|
Thrown in the trash / garbage hole |
52 |
6.3 |
|
Poured / rinsed into a drainage channel or ditch |
12 |
1.5 |
|
Left in the open |
14 |
1.7 |
|
|
Others |
1 |
0.1 |
Material used to wash the hands |
with Plain water |
241 |
24.1 |
water with soap |
661 |
66.2 |
|
water with other detergents |
67 |
6.7 |
|
water with ash |
14 |
1.4 |
|
Don't know |
1 |
0.1 |
|
|
Other |
14 |
1.4 |
Period of hand washing |
before preparing meals |
488 |
48.8 |
before feeding the children |
150 |
15.0 |
|
after going to the toilet |
186 |
18.6 |
|
after cleaning a child who has had a bowel movement |
86 |
8.6 |
|
|
before and after meals |
89 |
8.9 |
|
after touching a dirty object |
2 |
0.2 |
Disposal of household garbage |
Dispose of in nature (street, outside the yard, fed) |
207 |
20.7 |
deposit in a closed pit |
43 |
4.3 |
|
deposit in an open pit |
134 |
13.4 |
|
put in the garbage bins burn |
426 |
42.6 |
|
|
put aside (pile up) |
119 |
11.9 |
|
Don't know |
67 |
6.7 |
|
Other |
3 |
0.3 |
Table 2: Water, hygiene and sanitation characteristics of the survey household
Forms of malnutrition |
Degree of malnutrition |
Boys |
Girls |
Total |
[95%CI] |
[95% CI] |
[95% CI] |
||
Wasting |
Global |
8.6 |
4.2 |
6.5 |
Moderate |
7.1 |
3.5 |
5.3 |
|
Severe |
1.6 |
1.2 |
1.2 |
|
Z score Mean ± Standard deviation |
|
|
|
-0.35±1.02 |
Stunting |
Global |
22.9 |
17.0 |
20 .0 |
Moderate |
15.9 |
13.6 |
14.8 |
|
severe |
7.0 |
3.4 |
5.2 |
|
Z score Mean ± Standard deviation |
|
|
|
-0.95 ± 1.21 |
Underweight |
Global |
12.2 |
9.7 |
11.0 |
Moderate |
10.2 |
7.8 |
9.0 |
|
severe |
2.1 |
1.9 |
2.0 |
|
Z score Mean ± Standard deviation |
|
|
|
1.03±0.75- |
Table 3: Descriptive statitics, prevalence - 95% Confidence Interval (CI) for wasting, stunting and underweight, according to sex of study sample
Variable |
Modalités |
Acute Malnutrition |
Chronic Malnutrition |
Underweight |
|||
RR (IC95%) P value |
RR (IC95%) P value |
RR (IC95%) P value |
|||||
Water supply |
Tap / running water |
1 |
|
1 |
|
1 |
|
|
Public tap / fountain |
7,45(1,25-14,44) |
0,001 |
1,84(0,17– 20,50) |
0,619 |
7,13(1.1-14,68) |
0,001 |
|
Drill / Pump |
8,40(2,00-23,52) |
0,001 |
2,31(0,20-26,87) |
0,505 |
7,85(1,59-13,88) |
0,001 |
|
Protected water source |
6,87(1,54-18,87) |
0,001 |
1,92(0,17-6,36 |
0,767 |
6,06(0,06-12,05) |
0,001 |
Latrine |
Yes |
1 |
|
1 |
|
1 |
|
No |
7,30(1,16-18,39) |
0,001 |
1,28(0,26-6,36) |
0,767 |
2,59(0,52-13.00) |
0,247 |
|
Latrines used in the household |
other |
1 |
|
1 |
|
1 |
|
Flushing of water to a septic tank |
0,60(0,02-1,41) |
0,242 |
1,09(0,65–1,85) |
0,739 |
1,44(0,56-3,67) |
0,446 |
|
Single hole latrine without slab / floor |
0,55(0,32-0,95) |
0,032 |
1,51(1,09– 2,09) |
0,619 |
0,88(0,54-1,41) |
0,584 |
|
open defecation |
0,43(0,05-3,59) |
0,434 |
0,40(0,10– 1,50) |
0,174 |
0,40(0,07-2,37) |
0,314 |
|
Number of households sharing latrines |
1-3 |
1 |
|
1 |
|
1 |
|
4-6 |
0,97(0,37-2,53) |
0,956 |
1,09(0,65-1,85) |
0,739 |
2,73(1,34-4,69) |
0,004 |
|
7-10 |
0,81(0,29-2,24) |
0,679 |
1,51(1,09-2,09) |
0,014 |
1,58(0,80–3,13) |
0,187 |
|
more 10 |
1,97(0,37-10,56) |
0,429 |
0,40(0,10-1,50) |
0,396 |
2,63(0,89– 7,75) |
0,081 |
|
If in household children under three years old |
Yes |
1 |
|
1 |
|
1 |
|
No |
0,24(0,09-0,67) |
0,007 |
0,55(0,351-0,869) |
0,01 |
0,35(0,18–0,71) |
0,00 |
|
The last time the child defecated what was done to eliminate it |
other |
1 |
|
1 |
|
1 |
|
Child uses the latrine |
3,15(1,39-7,39) |
0,001 |
4,18(0,26– 67,45) |
0,313 |
2,81(1,50-5,25) |
0,001 |
|
Thrown / rinsed in latrines, Buried |
3.00(1,10-8,18) |
0,001 |
3,41(0,21– 56.00) |
0,390 |
3,764(1,68-8,46) |
0,001 |
|
Thrown in the trash / garbage hole |
1,96(0,88-2,88) |
0,001 |
5,10(0,31– 83,81) |
0,508 |
2,410(1,18-4,91) |
0,001 |
|
Poured / rinsed into a drainage channel or ditch |
2,42(1,11-3,20) |
0,001 |
2,58(0,16– 42,98) |
0,254 |
1,549(0,40-7,06) |
0,001 |
|
open defecation |
2,51(0,51-3,81) |
0,001 |
2,71(0,16– 45,03) |
0,487 |
1,62(0,62-8,52) |
0,001 |
|
When do you get up |
before preparing meals |
1 |
|
1 |
|
1 |
|
before feeding the children |
3,15(1,34-7,39) |
0,001 |
3,82(0,79-18,5) |
0,097 |
7,29(1,22-43,59) |
0,030 |
|
after going to the toilet |
3.00(1,11-8,18) |
0,001 |
1,71(0,34-8,69) |
0,518 |
6,45(0,96-43,15) |
0,050 |
|
after cleaning a child who has had a bowel movement |
1,99(0,82-7,88) |
0,001 |
3,43(0,69-17,20) |
0,134 |
3,42(0,57-20,45) |
0,178 |
|
before and after meals |
2,42(0,11-7,21) |
0,001 |
0,79(0,014-4,41) |
0,786 |
1,25(0,18-8,50) |
0,819 |
|
Washing materials |
other |
1 |
|
1 |
|
1 |
|
Simple water |
1,55(0,57-2,32) |
0,359 |
0,633(0,137– 2,922) |
0,313 |
3,50(0,45-5,03) |
0,835 |
|
Water with soap |
1,61(0,03-3,84) |
0,010 |
0,611(0,135– 2,762) |
0,843 |
3,13(0,17-4,83) |
0,019 |
|
Water with other detergents |
1,71(0,02-2,32) |
0,001 |
0,848(0,166– 4,33) |
0,522 |
7.00(0,81-7,26) |
0,437 |
|
Water with ash |
1,75(0,74-2,60) |
0,001 |
1,611(0,065– 4,371) |
0,624 |
2,67(1,12-3,79) |
0,906 |
|
Disposal of household garbage |
put aside (pile up)/other |
1 |
|
1 |
|
1 |
|
Dispose of in nature (street, outside the yard, fed) |
2,56(1,01-3,28) |
0,001 |
1,377(0,071– 2,541) |
0,001 |
1,558(0,541-6,852) |
0,010 |
|
deposit in a closed pit |
1,32(0,77-2,64) |
0,001 |
2,824(0,465– 4,447) |
0,001 |
6,722(1,357-8,329) |
0,001 |
|
deposit in an open pit |
1,84(0,33-2,02) |
0,001 |
2,517(0,061– 4,871) |
0,001 |
1,869(0,768-4,498) |
0,001 |
|
put in the garbage bins |
3,75(1,37-5,35) |
0,001 |
2,700(0,491– 5,028) |
0,001 |
4,478(1,969-4,498) |
0,001 |
|
burn |
2,60(1,33-4,10) |
0,001 |
2,043(1,023– 4,081) |
0,001 |
1,623(0,478-2,418) |
0,001 |
|
RR is Relative Risk; p is the level of significance of association between a modality and the malnutrition.
Table 4: Bivariate association of Hygiene, Water Parameters and Sanitation of family with forms of malnutrition in children under 5 years
Variable |
Modalités |
Acute Malnutrition |
Chronic Malnutrition |
Underweight |
|||
RR (IC95%) P value |
RR (IC95%) P value |
RR (IC95%) P value |
|||||
Gender of household heads |
Female |
1 |
|
1 |
|
1 |
|
|
Male |
1.34 (0.74 –2.44) |
0. 375 |
1.05 (0.78 – 1.41) |
0.772 |
1.03 (0.67 –1.57) |
1.000 |
Age of household heads |
< 25 |
1 |
|
1 |
|
1 |
|
|
26 – 44 |
1.82 (0.68 – 4.91) |
0.292 |
1.39 (0.91 – 2.14) |
0.172 |
1.22 (0.63 -2.39) |
0.551 |
45 – 65 |
1.69 (0.59 – 4.84) |
0.458 |
1.09 (0.81 – 1.46) |
0.641 |
1.20 (0.78 - .843) |
0.479 |
|
|
>66 |
0 |
1.000 |
2.67 (1.67 – 4.26) |
0.001** |
1.51 (0.40 –5.70) |
0.233 |
Marital status |
Single |
1 |
|
1 |
|
1 |
|
|
Married |
1.50 (0.22 – 10.0) |
1.000 |
1.36 (0.48 – 3.87) |
0.778 |
2.31 (0.34 -15.72) |
0.718 |
|
Divorced |
0 |
1.000 |
1.15 (0.23 – 5.87) |
1.000 |
1.73 (0.12 –24.97) |
1.000 |
|
Widower |
1.46 (0.14 – 15.0) |
1.000 |
1.27 (0.37 – 4.34) |
1.000 |
1.46 (0.14 – 1498) |
1.000 |
Household heads profession |
Official P /V |
1 |
|
1 |
|
1 |
|
Housewife |
1.01 (0.45 – 2.23) |
1.000 |
1.48 (1.00 – 2.19) |
0.056 |
2.78 (1.40 – 5.50) |
0.005** |
|
Trader |
1.08 (0.58 – 2.01) |
0.865 |
1.09 (0.77 – 1.56) |
0.653 |
1.63 (0.86 –3.10) |
0.167 |
|
Breeder / Agriculture |
1.05 (0.26 – 4.28) |
1.000 |
1.60 (0.85 – 3.01) |
0.200 |
2.30 (1.24 – 4.24) |
0.008 ** |
|
Pupil / Student |
1.07 (0.33 – 3.44) |
1.000 |
1.76 (1.05 – 2.93) |
0.056 |
4.65 (1.97 – 11.01) |
0.003** |
|
Other |
1.22 (0.70 – 2.15) |
0.540 |
1.08 (0.78 – 1.51) |
0.675 |
4.19 (1.90 – 9.50) |
0.002** |
|
Income (x1000 fcfa) |
< 50 |
1 |
|
1 |
|
1 |
|
50 -100 |
1.44 (0.77 – 2.71) |
0.322 |
1.83 (1.23 – 2.70) |
0.002** |
1.47 (0.78- 2.76) |
0.294 |
|
100-200 |
1.02 (0.51 – 2.12) |
1.000 |
1.49 (0.99 – 2.24) |
0.055 |
2.38 (1.39 – 4.06) |
0.001*** |
|
>200 |
1.05 (0.52 – 2.12) |
1.000 |
1.40 (0.91 – 2.15) |
0.126 |
1.63 (0.92 – .902) |
0.095 |
|
Religion household heads |
Christian |
1 |
|
1 |
|
1 |
|
Muslim |
2.12 (1.04 – 4.35) |
0.035* |
1.19 (0.78 – 1.84) |
0.479 |
3.42 (1.70 – 6.90) |
0.000*** |
|
Others |
0 |
1.000 |
1.22 (0.63 – 2.39) |
0.551 |
2.75 (0.38 –19.70) |
0.335 |
|
Household Size |
6-7 |
1 |
|
1 |
|
2.48 (0.34–17.92) |
0.364 |
<3 |
1.24 (0.59 – 2.64) |
0.670 |
1.30 (0.89 – 1.89) |
0.185 |
1 |
|
|
4-5 |
1.00 (0.45 – 2.26) |
1.000 |
1.15 (0.82 – 1.61) |
0.467 |
2.40 (1.34 – 4.30) |
0.004 ** |
|
8-9 |
1.00 (0.45 – 2.26) |
1.000 |
1.00 (0.57 – 1.78) |
1.000 |
1.96 (1.05 – 3.63) |
0.038* |
|
>10 |
1.09 (0.58 – 2.05) |
0.864 |
|
|
1.51 (0.87 –2.64) |
1.513 |
|
Education level of household head |
Out of school |
1 |
|
1.58 (1.06 – 2.36) |
0.039* |
2.10 (1.23 – 3.58) |
0.008** |
Primary |
2.03 (0.95 – 4.35) |
0.081 |
1.34 (0.87 – 2.06) |
0.204 |
1 |
|
|
Secondary |
1.71 (0.85– 3.45) |
0.142 |
1.28 (0.90 – 1.84) |
0.182 |
1.71 (0.94 – 097) |
0.078 |
|
Higher |
1.53 (0.54 – 4.45) |
0.533 |
1 |
|
1.52 (0.88 –2.60) |
0.136 |
|
Literate (Koranic school) |
5.33 (0.87 – 32.7) |
0.019* |
1.51 (1.06 – 2.15) |
0.024* |
2.23 (1.10 – 4.52) |
0.036* |
|
Table 5: Bivariate association of Socio-demographic and Economic Parameters with forms of malnutrition in children under 5 years
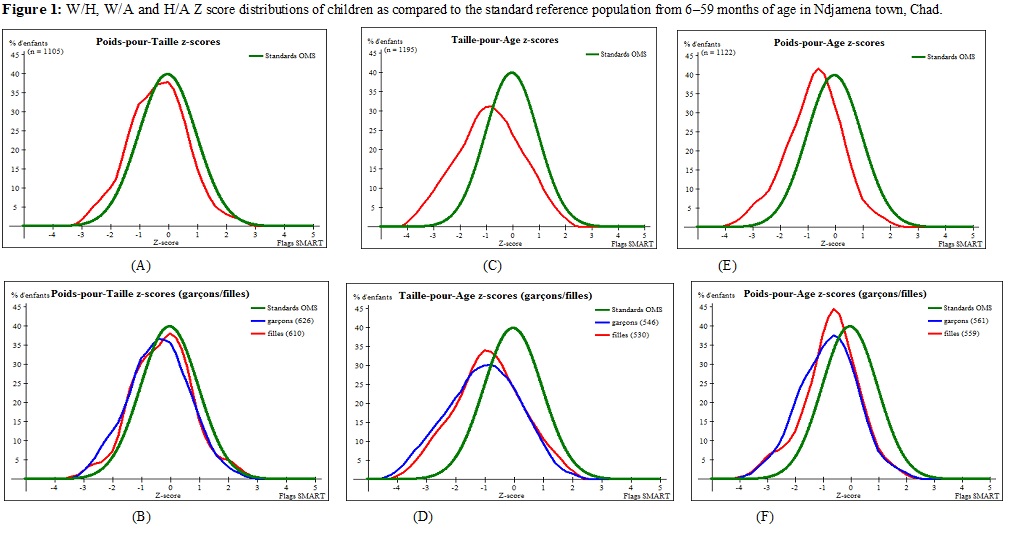 |
| Figure 1: W/H, W/A and H/A Z score distributions of children as compared to the standard reference population from 6–59 months of age in Ndjamena town, Chad. |
Introduction
Malnutrition is a very widespread problem in the world and in particular in African countries. It has negative impacts on children's physical and cognitive development and socio-economic development. In 2018, more than 200 million children under the age of 5 were estimated to be stunted or wasted, while at least 340 million suffered from unsuspected hunger [1]. Africa remains the only region in which the number of stunted children is rising steadily, reaching almost 260 million people in 2018, over 90% of whom lived in sub-Saharan Africa [2-4]. The situation is particularly alarming for Chad which needs thorough intervention. This is particularly urgent as malnutrition commonly has long lasting effects among children and adversely influences their adult logical and work capacity, hence the country economy and development [Galgamuwa et al., 2017] [5]. The nutritional status of children in a society are practically determined by Anthropometric measurements, while the public health interventions need to determine the associated factors through association with individual nutritional variables in a child population.
Previous studies in Chad reported in 2020 a deteriorated nutritional situation, with 2.2 million people malnourished, value that increase for 29% as compared to 2018 data [6]. Among the malnourished, nearly 350,000 children are at risk of severe acute malnutrition, an increase of 59% compared to 2018. Sixteen (16) of the country's twenty-three (23) provinces are located in the Sahelian bands and have been declared in a nutritional emergency. In these provinces, the prevalence of global acute malnutrition (GAM) and severe acute malnutrition (SAM) exceed the emergency thresholds [7-9]. Thus, despite many efforts that have been made to improve the nutritional situation in the country, malnutrition continues to affect large proportions of the Chadian population. This burden, which is due to several factors (health, environmental, food, economic, social) affects all social strata but especially children [1,2,10,11]. This worrying situation requires an intensification of interventions [8,12,13] to describe the situation and propose solutions aimed at guiding government policies. Before that, it is important to determine the extent of the malnutrition and the underlying causes in the NDAMENA Urban area.
With the aim of contributing to the improvement of this alarming situation, the present study was initiated with the objective of evaluating the impact of SED and WASH parameters on the nutritional status of children from 0 to 59 months in households of the city of N'Djamena.
Methodology
Study setting and design
The study was a cross-sectional survey among household in Ndjamena urban area from January to June 2020. Ndjamena is the capital of Chad, a Country in the sub-Saharan Africa characterized by a soudanian climate with two seasons: a rainy season at April – October and a dry season at November - March. The annual rainfall oscillates between 800 and 1200 mm while the the temperatures have their absolute minima in December-January (15°C) and the maxima in March-April (40°C). The relative air hygrometry is maximum (80%) in July-August-September [14].
The study population consisted of households with at least one child under 5 years old, and their mother of childbearing age, agreeing to participate in the study. Households with no children aged 0 to 59 months, and those who did not return their consent forms were excluded from the study. The size (n) of the sample was calculated with the formula n = Z2pq/e2 with p being the expected frequency (30%) of the malnutrition, Z equal to 1.96 at 95% confidence limit, (3%) the margin error fixed in the study. Based on the above, the minimum sample size was 896. We included in the study 1081 children following a multi-stage stratified cluster sampling design in which the household was the basic sampling unit.
Clusters were firstly selected based on the probability proportional to the size of the population of the primary sampling units (EA). This is how each stratum (District) had its sampling frame, made up of an exhaustive list of all the enumeration areas (EAs) belonging to it. For this, the ENA for SMART software version of July 09, 2015 was used for this selection. This procedure ensures the representativeness of the sample at the level of each of the boroughs. This is the condition that made it possible to reach the entire target population with representativeness of the sample.
In each cluster, households were selected using systematic sampling. In this respect, the sampling interval was calculated in each selected cluster as the ratio of the estimated total houses (N) to the number of households to be surveyed (n). The household has been defined as "a collective unit or a social group, made up of related or unrelated individuals, living under the same roof, under the authority of a head of household, sharing their resources and expenses then eating the same meals [15].
Collection of data
Data collection was carried out by 10 teams made up of two investigators each and under the supervision of three experts. All were previously trained and subjected to a 2-day pilot survey. The researcher team visited the child and the parents in the households, and explained to them the objective of the study. A written consent was then proposed to them and after signature, the parents were interviewed to collect their socio-demographic and economic characteristics (gender, age, marital status, household size, number of children, monthly income, level of education, religions and occupation of the head of the household), the sanitary and household conditions (Water supply, Latrine availability, types of latrines, availability in household children under three years old, The last time the child defecated what was done to eliminate it, will What do you wash your hands, When do you get up, Disposal of household garbage) using an interviewer administered structured questionnaire. The child's age was determined from the date of birth recorded in his vaccination record, or given by the parents. In case the mother did not know the child's age, a calendar of events was drawn up including important religious, political and environmental events, so that the age in months could be estimated. Particular attention was paid to the events that could be used to estimate the age around the threshold of 6 months to 5 years.
Assessment of nutritional status in infant
Anthropometric measurements (weight, height) were made according to standard procedures [1,7,9]. The children weight was measured using the electronic bathroom scale (approximately 100 grams). The size was taken using a precision 1 mm measuring rod. In the case of children under 2 years of age or less than 85 cm tall, the measuring board was placed in a horizontal position on a flat surface and parallel to the ground and the height was measured in millimeters and then taken in the supine position. Children with height between 85 and 115 cm were measured while standing by positioning the height board vertically. The presence of nutritional edema was assessed by applying light pressure with the thumb behind the foot for about 3 seconds, then examining it to see if it kept the impression made by the pressure of the thumb. MUAC was measured with a tape and compared with the risk thresholds for MUAC malnutrition according to the growth norms of [9,11]. Two different researchers took the measurement to minimize intrapersonal errors.
Nutritional indices W/H (weight-for-height), H/A (height-for-age) and W/A (weight-for-age) were calculated and standardized into specific Z scores by The ENA (Emergency Nutrition Assessment) software. The indices define the three forms of malnutrition wasting (acute malnutrition), stunting (chronic malnutrition) and underweight, respectively. The Z-scores were calculated according to the new standards of anthropometric parameters published in April 2006 making it possible to assess the growth and development of children from birth to the age of 5 years [7,9,16-18]. Z-score below -2 standard deviations indicates moderate while Z score below -3 indicates severe malnutrition.
Data analysis
Questionnaire development and the data analysis were performed using the Sphinx plus²-Edition lexica-V5 software. Categorical variables were presented as number and frequency, and the 95% confidence interval calculated. The ENA (Emergency Nutrition Assessment) software for SMART version of July 09, 2015, allowed us to calculate the z-score of each parameter, giving the curves, the proportions of the three types of malnutrition according to the standards of [4,7,11]. We also used this software to perform random sampling for the selection and selection of the cluster. The chi-square test on Stratigraphic software was used to analyze the frequency of nutritional indicators (underweight, stunting and wasting). Multivariate Linear and logistic regressions using Graph pad prism 5 software were applied to study the association of socio-economic, demographic and WASH variables with nutritional indicators (dependent variables: stunting, underweight and wasting). Relative Risk (RR) with 95% confidence interval was calculated for each factor in models. The statistical confidence limit was fixed at 0.05.
Results
Demographic and socioeconomic characteristics
The sample size set at the start of the study was completed, as all selected households were surveyed. Table 1 presents some socio-economic, demographic and socio-professional characteristics of heads of households. In all of the households surveyed in the city of Ndjamena, it was observed that the households were majorly headed by men (80, 1%) and the average age was in 75.2% lower than 45 years. More than half (78.3%) of the surveyed population practice Islam against 19.8% for Christian and 0.9% for animist. Most heads (93.5%) of households were married and very few were single (1.9%), widowed (1.10%) or divorced (2.6%). Many of them work either in the informal sector (31.3%), the public (26.97%) and private (23.68%) officials.
Note that the level of education of heads of household is very diverse with the koranic, secondary and university levels being the most represented at quite equivalent frequency, 22.3-26.7-26.2%, respectively; the primary and out-of-school levels were less frequent, 12.4% and 12.3%, respectively. The income of household’s heads was fairly equitably distributed between less than 50 thousands fcfa (19.4%) to over 200 thousands fcfa (22.8%), the highest frequent (30.0%) class for income being 50-100 fcfa. The size of the household revealed a normal distribution from the size ≤ 3 with 21% frequency to ≥10 persons with 7.3% frequency. The median was observed at 4-5 with a frequency of 38.8% while the average household size was 5.5 people per household in the site of study. All the households surveyed had at least one child with a total of 1248 children under 5 years old of age evaluated for their nutritional characteristics.
Water, sanitation and hygiene characteristics of households
Water is qualitatively and quantitatively essential for living organism. The quality of the drinking water supply used by the household is an indicator whether their drinking water is of nutritional quality and healthy. The following “improved” water sources are considered to be of suitable quality: running water supply at home or in a yard / plot, public tap / standpipe, tube well / borehole (with pump), protected dug well, spring protected. The results showed that almost half of households (569, 56.8%) used tap water as a source of drinking water while third of them (320, 32.0%) used the borehole / pump. Almost all the households (993, 99%) used a latrine, but 497 (32.7%) used a single-hole latrine without a slab / floor. In addition, 1-3 persons share a single latrine in 2/3 of households while 2-6 shared in 22.2% households. Most of the households 817 (81.7) visited have a child under 3 years and elimination of feces in the major case 675 (82.4%) is thrown, rinsed in latrines or buried.
Most of the families 661 (66%) washed their hand with soap while about 22.2% used water without detergent. About 488 (48.8%) of households were reported to wash their hands before preparing meals, 18.6% after going to the toilet. Regarding household garbage disposal, the result was that about half of 426 (42.6) households put their garbage in burning garbage bins.
Child nutritional status
Figure 1 report the distribution of the Z scores (W/H; W/A; H/A) of the sampled population compared to WHO child growth standards 2006. It may be observed that the Z scores means for W/H, W/A and H/A moved to the left in negative Z values, W/H being the most distant from the reference, followed by W/A. These observations were similar in males and females with the exception that distribution of W/H for males was more deviated than that of females. One important characteristic of these distributions is their normal shape, owing to the determination of their means and standard deviations. The Z score means of the different forms of malnutrition clearly revealed the deviations with values varying from -0.35±1.02 for W/H to - 0.95 ± 1.21 for H/A (Table 2). The malnutrition indicators associated to these distributions are described in Table 3. The results showed that 20 % of the children suffered from stunting with 5.2% in severe conditions while only 6.5% suffered from wasting with 1.2% being severe. In addition, 11.0% of the children surveyed were underweight, of which 2.0% had the severe form.
Bimodal association of WASH variables and malnutrition status of child
Table 4 showed the association of household water, hygiene and sanitation (independent variables) with nutritional status of children. It emerges from this table that the independent variables water supply, presence of latrine, number of resident and periods of hand washing significantly affected at least one type of malnutrition, wasting being the most affected. Number of households sharing latrines was not associated with the wasting but was associated with stunting and underweight. In this respect households with 7-10 peoples significantly (p=0.014) increased RR (1.5) of stunting while those with 4-7 residents significantly (p=0.004) increased RR (2.73) of underweight. In addition, presence of tap running water in households, presence of latrine and washing hand before preparing infant meals significantly (p<0.001) decreased RR of either wasting or stunting and underweight. Public tap water, drill/pump and protected water source highly significantly (p<0.001) increased RR of wasting and stunting. Children from households without a latrine were at risk (RR=7.3) of wasting than children from households with latrines. The period of hand washing before feeding the child had no significant association with stunting. However, washing hand before feeding the child or after going to the toilet highly increased RR of wasting and underweight. Households with children under 3 years old were at risk of being affected by one or more malnutrition with RR of between 1.8-4.1. Likewise, children of mothers who were washed after breastfeeding, after washing the child after bowel movements were associated with the three forms of child malnutrition, with RR 3.00, 1.71 and 6.450, respectively for wasting, stunting and underweight. Finally, the results showed that children from households, whose mothers washed after touching a closed pit, were at risk of being affected by wasting, underweight with RR 2.42 and 1.25, respectively, compared to children of mothers washed before preparing meals. In general, water, hygiene and sanitation parameters are still considered to be factors significantly associated with acute, chronic and underweight malnutrition in households with children under 5 years in the region of Ndjamena.
Bimodal association of Socio-demographic Economic parameters and malnutrition status of child
The analysis of Table 5 has shown that there is a certain correlation between the socioeconomic parameters (income, household size, marital status and gender), socio-professional (profession, level of education and the religious belief of the head households) and the malnutrition (acute, chronic and underweight) of children from households in the city of N'Djamena. Two factors were associated with acute malnutrition, the religion (Muslim being the most affected, RR=2.12) and the educational level of head of family with koranic being mostly affected (RR=5.33). Wasting (acute malnutrition) is one of the most severe forms of malnutrition in children 0-59 months which was revealed in this study to affect 6.5% of the surveyed population. Wasting was affected by many factors including age of household, income of the family, and educational level of head of the household. It emerges from the bivariate analysis reported in Table 5 that children with the oldest household heads (66 years and over), with income 50 000-100 000 fcfa, out of school or in koranic school were likely prompt to chronic malnutrition than the others. Underweight was highly linked to household head profession, educational level, religion family income, and the income and the number of person living in the family. In particular, the profession trader, housewife, agriculture, student, families with income 100-200 000frs cfa, Muslim families, children out of school or in koranic school were mostly highly affected by child underweight.
Discussion
Child malnutrition remains a public health problem at Ndjamena, Chad. In spite of the multilateral strategies spread since 2010 to monitoring malnutrition, and the creation of the national committee for challenging malnutrition in 2017, Wasting (6.5%), stunting (20.0%) and underweight (11%) were still at significant frequencies. While wasting was precarious, the situation of underweight and stunting were worrying, results which were relevant the problematic of this study. Similar high frequencies of underweight were recently reported in three different survey by the Chadian national studies [8,13,15]. In the region of Logone-Chari in Cameroon, 3 different studies reported underweight rate of 13.9%, 11.53% and 12.56% [19-22]. Although Ndjamena and Kousseri are regions from different countries, Chad and Cameroon, their neighborhood and sharing of similar environmental conditions may justify their nutritional behavior. In addition to this, they may also share the same demographic, water, sanitation and hygiene characteristics, factors that are known to influence the status of malnutrition in a population. These variables were associated with the three types of malnutrition studied, with relative risk proportions (RR) greater than the dominator which is set one (1) then the confidence interval which is set at 95% (95% CI) and with a P value of significance at (P <0.05).
Sociocultural characteristics of household include religion, academic and living standard, profession, which were shown to be associated with child malnutrition in Ndjamena, Chad. In this respect a clear relationship between being parental characteristics Muslim (P <0.001), studied koranic studies (P <0.0008) or have not studied (P <0.0008) to school and having a child underweight was observed. Precisely Muslim families and families that the head has less education were two to three times more likely to be at risk compared to other beliefs, such as Christianity and Animism, or those with higher education. This result corroborates many others [23,24], which indicated that a low level of education is a significant favor risk of malnutrition. Muslim generally studied koranic or do not go to school, thus justifying the association of underweight with those factors. In addition, families with 4-5 or 8-9 individuals were significantly (P <0.05), more likely to have a child underweight compared to the one who had an average between 6-7 people. Indeed, the number of individuals within households is another important factor that influenced child underweight. Generally, it is believing that families with high number of individuals generally faced malnutrition [25-27]. In fact, several studies reported that as the proportion of members in family increase, the income of the family become low to take care of the whole. Studies conducted elsewhere revealed that low income has an undesirable result on the condition of children [3,20].
Acute malnutrition (Emaciation) was observed in the surveyed population with a rate of 6.5%. Analysis of the relationship between wasting (Weight-for-Age) with certain socio-demographic and economic factors showed some correlation with heads of household. Indeed, children from male-headed households were more sensitive to the risk of being affected by wasting, compared to children from female-headed households (RR: 1.025, (CI 0.66 - 1.57). In addition, there was a significant difference between the age groups of heads of household, because the children whose heads were <25 years old, 26-44 years old and > 66 years old, were over at risk than children whose head was between [45-65] years old. This current study supported by different studies in Ethiopia and elsewhere has reported that male children under the age of five were more likely to become stunted than their female counterparts [28-31]. In addition, it was shown in this study that children in married families were significantly twice as likely as children from single families, and divorced or widowed families. These results, similar to other studies [14,32-36], have shown that advanced age was significantly associated with wasting in children. This observation could be due to the fact that married couples have more responsibilities than single people and widows. However, the difference was observed between the occupation of the head of household, and this type of malnutrition. Indeed, the children of traders and Breeder / Farmer were four (4) times more at risk, and the children of students / pupils were 2 times at risk, as compared to the children of household employees (Public / Private). This could be explained by an organizational problem where agricultural/ Farmers, housewife do not devote enough time to supervising children, because the activities carried out by the latter do not benefit the children.
Chronic malnutrition was significantly (P<0.05) associated with certain socio-professional and socio-economic factors. As for household income, it was pointed out that this factor is significantly associated with this type of malnutrition. Likewise, the observation was observed on religion, because religious culture has an impact on the life and behavior of a person as the appropriation of an idea. It is therefore possible that the living conditions of children will improve with the improvement of certain socio-economic factors [37,38]. This result was consistent with other studies carried out in Lalibela, northern Ethiopia, which show that the main contributing factors of stunted children under five were found at the child's age Health and socio-economic care, factors associated with stunting or chronic malnutrition [18,39].
Furthermore, we note that the three forms of malnutrition (wasting, chronic and underweight) were significantly associated with WASH factors. Regarding household water supply, it was noted that the influence of household water supply source quality was significantly (P<0.05) associated with child malnutrition. This is in agreement with several previous works that have shown the source of water supply to affect the health and nutritional status of children, may contain certain pathogens that cause diarrhea in children. Likewise, the finding was observed on the latrine sanitation facility (toilets), the study revealed that the non-existence of a latrine was significantly associated with the nutritional status of children. This is consistent with several studies that have examined this question, similar to that of shrestha [40] in Nepal, which reported household access to latrines reduced the risks of association, then higher than those of AT Merchant [ 41] in Khartoum. This could be explained by several hygienic, environmental and sanitary conditions including the use of sanitary latrine to elude excreta contact, the latter could cause sanitary infection or cause diarrhea which is responsible for infant deaths in developing countries. However, we found that households had mothers who demonstrated washing hands before feeding children, after bathing, after cleaning children's stool was significantly (p<0.05) associated with all forms of undernutrition. This is consistent with the hypothesis that certain maternal hygiene practices were significantly associated with child malnutrition. According to some authors, personal hygiene practices were more stringent maternal protective effects when accompanied by improved household access to running water and toilets [42]. Clearly, efforts to improve the handwashing practices of both mothers and the children themselves are essential to avoid diarrhea and other infections in children, which in turn, can help reduce malnutrition. These efforts should be accompanied by concrete actions aimed at improving household water and sanitation.
Conclusions
This study allowed us to note that two forms of children malnutrition, underweight and stunting are at a worrying status in Ndjamena, Chad. Both forms of malnutrition are correlated to some socio-professional, socio-economic, and most of the water, sanitation and hygiene conditions of the population. Male children are the most affected. Families which practice Muslim religion, less educated or age >60 years are major sociodemographic factors favoring malnutrition. WASH conditions in household are to deplore in most cases. In overall, it become clear that high rate of stunting and underweight in the Ndjamena town is due to bad hygiene, bad living conditions and lack of nutritional education which the consequences are dramatic on children given the fragility of their physiological state, immune system and the development of their growing organism.
Acknowledgements
We would like to thank the authorities of the University of Ngaoundere, the Regional Delegation of Public Health of Ndjamena, the National Directorate of Food Technology and the district heads of the Ndjamena region, not to mention the collecting members.
Contributions from the authors
ABC and D designed the study, analyzed the data, and wrote and revised the manuscript. EFI oversaw the data analysis and writing. GH participated in data analysis and structured and edited the manuscript. AH prepared the database and participated in data analysis. CIAH have participated in the preparation of the database.
Funding
The authors were conducting this study without receiving any funding support.
Study limits
The limits of our study are mainly at the level of the parameters of the mother of the child, the food and health practice of the child, certain environmental factors, and finally the indicators of poverty that were not taken into account.
Recommendations
As recommendations, it would be important to: - Place a lot of emphasis on improving the living environment of the child by combating poverty, in particular by improving access to food resources and household conditions. - Promote the socioeconomic situation of households (literacy, girls' education, equality and equity) for optimal use of these resources.
Ethical approval and consent to participate
The investigation was carried out following the authorization of the competent authorities according to the memorandum N ° 035 of January 2020 from the Health Delegation. The investigation was only conducted after obtaining consent as a preamble to the investigation form. The confidentiality of the data was guaranteed, the identity of the child was not revealed and when the interviewers visited the households, all the children meeting the admission criteria (MUAC <115 mm) were referred to the nearest health center.
Voluntary participation and withdrawal from the study
The head of household has the right not to take part in the survey or to refuse the further use of data concerning him. Any withdrawal from the investigation will not be prejudicial.
Confidentiality
All data collected has been treated confidentially. Numbers (codes) were used to identify each participant, and anonymity was therefore respected. Only the study manager has access to individual data. In any case, the individual results of the participants were not communicated to other persons. Study data was retained until the end of the investigation.
References
- UNICEF (2009) (United Nations Children's Fund) 2009. Tracking Progress in Maternal Nutrition [(Fonds des Nations Unies pour l’Enfance) 2009. Suivre les progrès dans le domaine de la nutrition de la mère : New York], USA.
- World Health Organization (2008) Indicators for Assessing Infant and Young Child Feeding Practices: Conclusions of a Consensus Meeting Held 6–8 November 2007 in Washington DC, USA.
- Paudel R, Pradhan B, Wagle R (2012) Risk factors for stunting among children: a community based case control study in Nepal. Kathmandu Univ Med J 10: 18-24.
- World Health Organization (WHO) Indicators for assessing infant and young child feeding practices. Part II: Measurement, Geneva, Switzerland.
- Galgamuwa LS, Iddawela D, Dharmaratne SD, Galgamuwa GLS (2017) Nutritional status and correlated socio-economic factors among preschool and school children in plantation communities, Sri Lanka. BMC Public Health 17: 377.
- IPC ACUTE MALNUTRITION ANALYSIS Chad: Persistence of a serious to critical nutritional situation in 2020 August 2019 – May 2020 Published in March 2020 [ANALYSE IPC DE LA MALNUTRITION AIGUË Tchad : Persistance d’une situation nutritionnelle sérieuse à critique en 2020 Août 2019 – mai 2020 Publié en mars 2020].
- OMS (2006) WHO Child Growth Standards Length/Height for Age, Weight for Age, Weight for Length, Weight for Height and Quetelet Index for Age. Methods and elaboration. Department of Nutrition, Health and Development [Normes OMS de croissance de l’enfant Longueur/taille pour l'âge, poids pour l'âge, poids pour la longueur, poids pour la taille et indice de Quételet pour l'âge. Méthodes et élaboration. Département Nutrition, santé et développement].
- Final report national SMART nutrition survey (2019): Ministry of Public Health and National Solidarity of Chad [Rapport final enquête nationale de nutrition SMART (2019) : ministère de la sante publique et de la solidarité nationale du Tchad].
- OMS (2010) The health professional's guide to the new WHO growth charts [Le guide d’utilisation des nouvelles courbes de croissance de l’OMS à l’intention du professionnel de la santé]. Paediatr Child Health 15: 91-8.
- World Health Organization (2011) Noncommunicable Diseases Country Profiles 2011:Nicaragua, USA.
- World Health Organization (WHO) Multicentre Growth Reference Study Group (2006) WHO Child Growth Standards: Length/Height-for-Age, Weight-for-Age, Weight-for-Length, Weight-for-Height and Body Mass Index-for-Age: Methods and Development. Geneva: WHO.
- Yessoufou AG, Yessoufou KA, Gbaguidi B, Sezan A, Agbere A-RD (2015) Anthropometric evaluation of the nutritional status of children from 0 to 59 months received at the vaccination unit of the CHR Lomé-Commune (Togo) [Evaluation anthropométrique de l’état nutritionnel des enfants de 0 à 59 mois reçus à l’Unité de vaccination du CHR Lomé-Commune (Togo)]. J Rech Sci Univ Lomé (TOGO) 17: 21-32.
- Rapport final enquête nationale de nutrition SMART (2020) Ministry of Public Health and National Solidarity of Chad [ministère de la sante publique et de la solidarité nationale du Tchad].
- Broquet M (2008) Assessment of the nutritional situation in the city of N'Djamena Chad: inventory and impact of the world food crisis [Evaluation de la situation nutritionnelle dans la ville de N’Djamena Tchad : état des lieux et impact de la crise alimentaire mondiale]. N’Djamena ACF 2008.
- Rapport final enquête nationale de nutrition SMART (2018) : ministère de la sante publique et de la solidarité nationale du Tchad.
- Moursi M, Razafindrazaka V, Dos Santos P, Bruyeron O, Arnaud L, et al. (2003) Food practices and nutritional status of children under two years old in Madagascar: districts of Andohatapenaka and Ampefiloha-Ambodirano in Antananarivo, villages of Ampasimbe, Andovoranto and Sahamorona in the sub-prefecture of Brickaville [Pratiques alimentaires et état nutritionnel des enfants de moins de deux ans à Madagascar : quartiers d’Andohatapenaka et d’Ampefiloha-Ambodirano à Antananarivo, villages d’Ampasimbe, Andovoranto et Sahamorona dans la souspréfecture de Brickaville]. Rapport Nutrimad : 49p.
- World Health Organization (2010) Indicators for Assessing Infant and Young Child Feeding Practices: Part II Measurement. Geneva: WHO.
- Yalew BM. Prevalence of malnutrition and associated factors among children age 6–59 months at Lalibela town administration, North WolloZone, Anrs, Northern Ethiopia. J Nutr Disorders Ther. 2014;4 (132):2161–2509. doi:10.4172/2161-0509.1000147.Mananga MJ, Kana–Sop MM, Nolla NP (2014) Feeding practices, food and nutrition insecurity of infants and their mothers in Bangang rural community, Cameroon. J Nutr Food Sci 4: 264.
- Patel R, Oken E, Bogdanovich N, Matush L, Sevkovskaya Z, et al. (2014) Cohort Profile: The Promotion of Breastfeeding Intervention Trial (PROBIT). Int J Epidemiol 43: 679-90.
- Yessoufou AG, Vinou AY, Gbaguidi B, Affognon JK, Baba-Moussa LS, et al. (2016) Diversity in food and nutritional status in children from 6 to 59 months in the municipality of Abomey-Calavi Southeast of Benin (West Africa). Int J Ad Rech 4: 594-600.
- Yadav DK, Chaudhary U, Shrestha N (2011) Risk factors associated with low birth weight. Journal of Nepal Health Research Council 9: 159-64.
- Azzaoui F-Z, Ahami AOT, Khadmaoui A (2008) Relationship between socio-economic and environmental factors and malnutrition: Case of children aged 6 to 8 years from the Gharb plain (North-West Morocco) [Relation entre les facteurs socio-économiques, environnementaux et la malnutrition: Cas d'enfants âgés de 6 à 8 ans de la plaine du Gharb (Nord-Ouest Marocain)], Antropo 17 : 1-5.
- Ouagadjio B, Nodjimadji K, Bagamla T, Madnodji R, Tokindang JS, et al. (2005) 2004 Chad Demographic and Health Survey [Enquête Démographique et de Santé Tchad 2004]. Calverton, Maryland, U.S.A
- Brhane G, Regassa N (2014) Nutritional status of children under five years of age in Shire Indaselassie, North Ethiopia: examining the prevalence and risk factors. Kontakt 16: e161–e70.
- Kumar D, Goel NK, Mittal PC (2006) Influence of infant-feeding practices on nutritional status of under-five children. Indian J Pediatr 73: 417-21.
- Bansal P, Garg S, Upadhyay HP (2019) Prevalence of low birth weight babies and its association with socio-cultural and maternal risk factors among the institutional deliveries in Bharatpur, Nepal. Asian Journal of Medical Science 10: 77-85.
- Paudel R, Pradhan B, Wagle R (2012) Risk factors for stunting among children: a community based case control study in Nepal. Kathmandu Univ Med J 10: 18-24.
- Bechir M, Schelling E, Moto DD, Tanner M, Zinsstag J (2011) Nutritional status and dietary diversity among nomadic and sedentary rural women on the south-eastern shore of Lake Chad [Statut nutritionnel et diversité alimentaire chez les femmes nomades et sédentaires rurales de la rive sud-est du Lac Tchad] : Médecine Tropicale, 71.
- Betebo B, Ejajo T, Alemseged F (2017) Household food insecurity and its association with nutritional status of children 6–59 months of age in east Badawacho District, south Ethiopia. J Environ Public Health 2017: 1-17.
- Mondal N, Sen J (2010) Prevalence of under-nutrition among children (5-12 years) belonging to three communities residing in a similar habitat in North Bengal, India. Ann Hum Biol 37: 199-217.
- Raihan MJ, Choudhury N, Haque MA, Farzana FD, Ali M, et al. (2020) Factors associated with moderate wasting among marginalized 6 to 23-month aged children in Bangladesh: Findings of the Suchana program baseline survey data. PLoS ONE 15: e0236786.
- Sen J, Mondal N (2012) Socio-economic and demographic factors affecting the Composite Index of Anthropometric Failure (CIAF). Annals of Human Biology 3: 129-36.
- de Onis M, Garza C, Onyango AW, Martorell R (2006) WHO Child Growth Standards. Acta 1 Paediatrica 95: 1-101.
- Nandy S, Irving M, Gordon D, Subramanian SV, Smith GD (2005) Poverty, child undernutrition and morbidity: new evidence from India. Bull World Health Organ 83: 210-6.
- Ricci JA, Becker S (1996) Risk factors for wasting and stunting among children in Metro Cebu, Philippines. The American journal of clinical nutrition 63: 966-75.
- Choudhury N, Raihan MJ, Sultana S, Mahmud Z, Farzana FD, et al. (2017) Determinants of age- specific undernutrition in children aged less than 2 years—the Bangladesh context. Maternal & child nutrition 13: e12362.
- Howe LD, Tilling K, Galobardes B, Davey Smith G, Gunnell D, et al. (2012) Socioeconomic differences in childhood growth trajectories: at what age do height inequalities emerge? J Epidemiol Community Health 66: 143-8.
- Hatloy A, Halland J, Diarra M, Oshaug A (2000) Food variety, socioeconomic status and nutritional status in urban and rural areas in Koutiala (Mali). Public Health Nutr 3: 57-65.
- Akina S, Jeanne S, Dikshya D, Sara M, Regula M (2020) Association of nutrition, water, sanitation and hygiene practices with children’s nutritional status,intestinal parasitic infections and diarrhoea in rural Nepal: a cross-sectional study. BMC Public Health 20: 1241.
- Merchant AT, Jones C, Kiure A, Kupka R, Fitzmaurice G, et al. (2003) Water and sanitation associated with improved child growth. European Journal of Clinical Nutrition 57: 1562-8.
Rah JH, Cronin AA, Badgaiyan B (2015) Household sanitation and personal hygiene practices are associated with child stunting in rural India: a cross-sectional analysis of surveys. BMJ Open 5: e005180.
Artcle Information
Research Article
Received Date: April 06, 2025
Accepted Date: April 23, 2025
Published Date: April 30, 2025
Annals of Public Health and Preservative Medicine
Volume 1 | Issue 1
Citation
Al Cherif Hamid M, Himeda M, Agume ASN, Bada AL, Bechir M, et al. (2025) Nutritional Status of Children Under 5 Years Associated to Socio-Economic, Demographic and Water, Sanitation and Hygiene Factors in Ndjamena, Chad. Ann Public Health Preservative Med 1: 104
Copyright
©2025 Agume ASN. This is an open-access article distributed under the terms of the Creative Commons Attribution License, which permits unrestricted use, distribution, and reproduction in any medium, provided the original author and source are credited.

doi: appm.2025.1.104